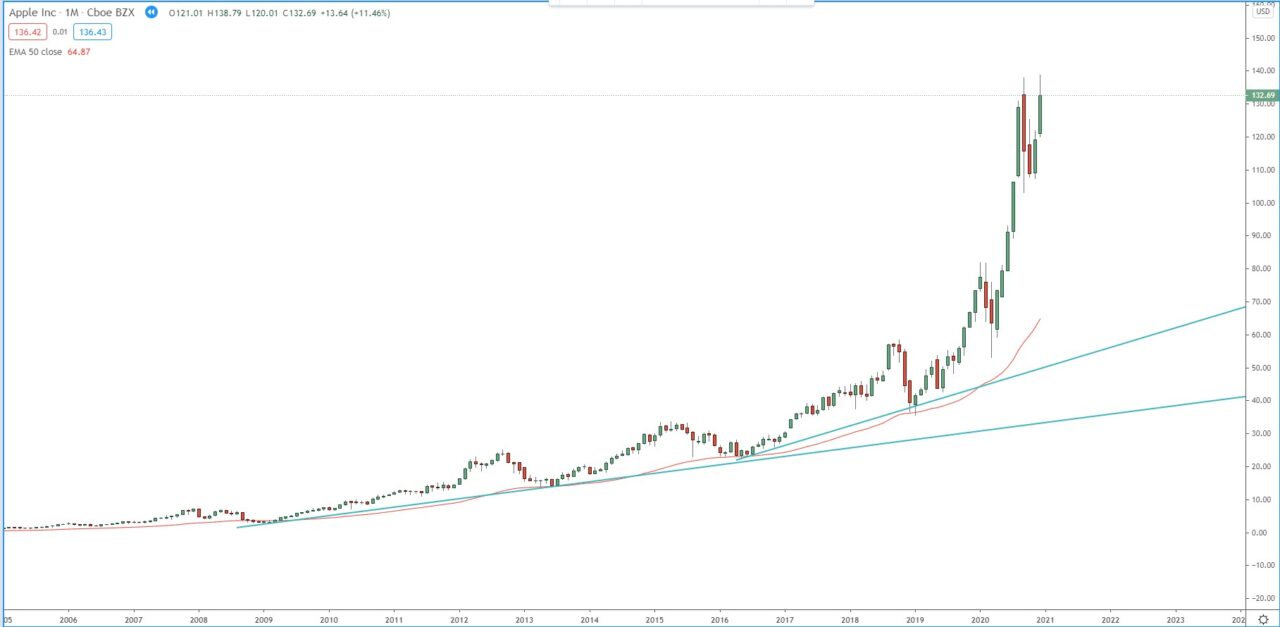
Analysis on the monthly chart for Apple shares, is reviewing that, in 2019 the price reached 2.618 FIB extension of the 3rd bullish monthly wave around 79.00 – 80.00 and concluded the 3rd bullish monthly wave, followed by 30% decline. Now the monthly chart is within its 5th bullish wave, the first target of that wave is the 1.272 FIB extension around 140, the second target is the 1.618 FIB extension around 163.00.
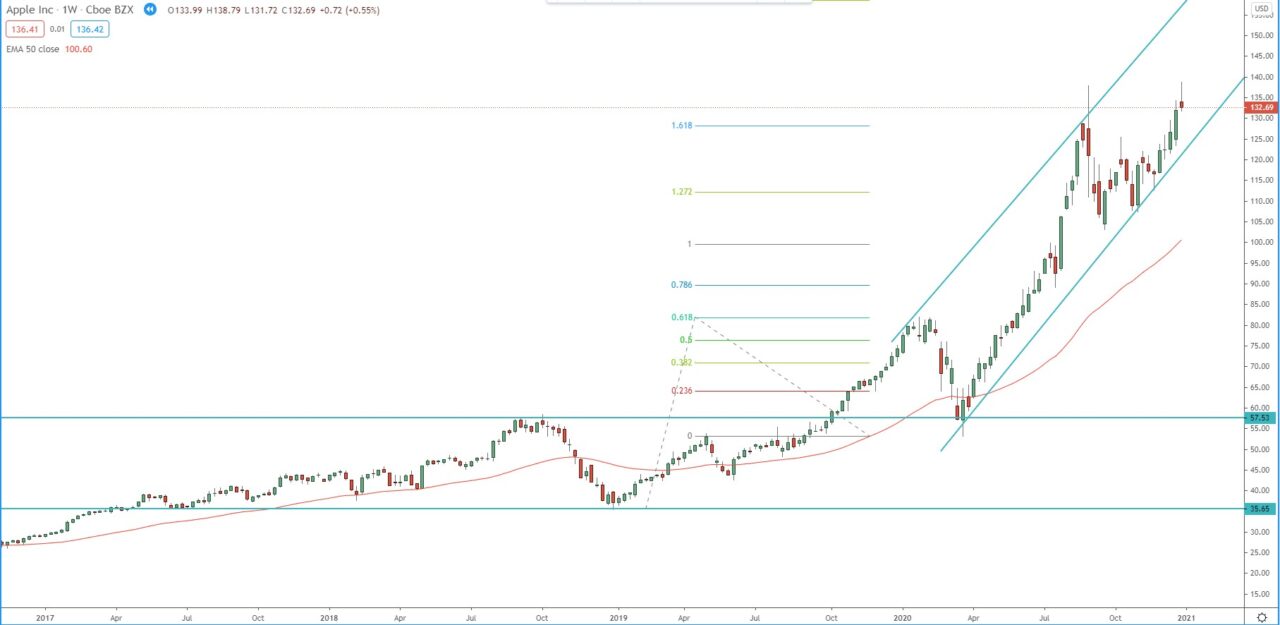
On the weekly chart, we can see that the breakout above the range 35.65 – 57.50 in 2019, started a new weekly bullish run. The second target of that run at 1.618 FIB extension around 128.00 was reach in the summer of 2020 and we saw 25.00% decline after that. The weekly chart already closed above the 128.00, next target for the bulls is the 2.272 FIB extension around 158.00.
Monthly chart:

Weekly chart:


