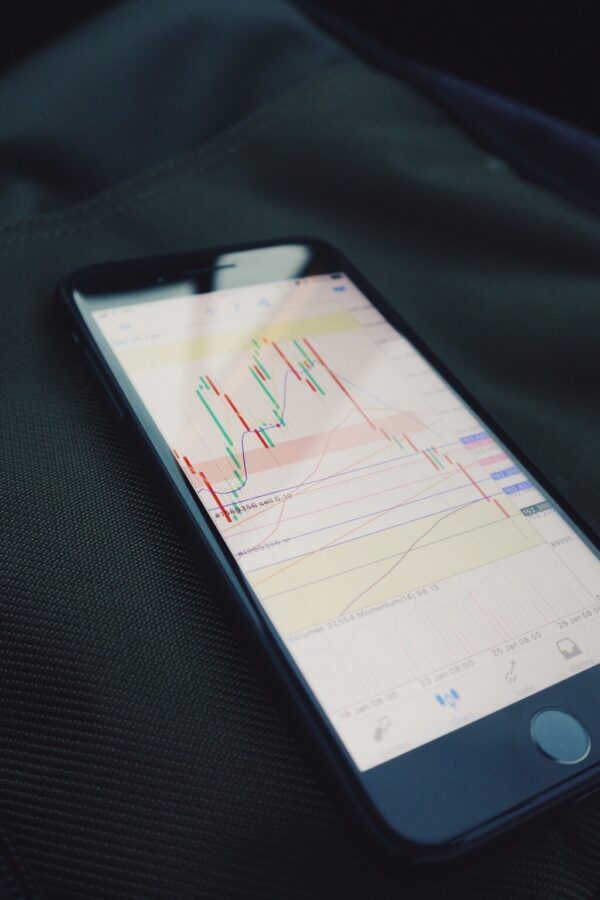
DXY dollar index technical analysis, the index is decelerating at support zone for three weeks now, unwilling to break lower for a retest of 2021 low and eventually a retest…
Read the post
DXY - Technical Analysis
We publish our technical analysis for DXY dollar index when we see technical changes in the charts. We focus on breakouts, technical patterns, key support, and resistance levels, combined with a trend/wave-based analysis.
Our mission is to help you improve your technical analysis, forex trading, and investing.
DXY dollar index technical analysis, the index closed with bearish engulfing on the weekly chart, resuming the bearish trend
Technical analysis for the DXY index, the index broke below the previous daily low at 90.42, closing the week with bearish engulfing on the weekly chart, resuming the bearish trend. The…
Read the post
DXY dollar index technical analysis, the index bounced from 0.618 FIB retracement and formed morning star on the daily chart
Technical analysis for the DXY dollar index is showing that the index closed with a bullish inside bar on the weekly chart bouncing from 0.618 FIB and formed morning start…
Read the post
DXY Dollar Index Technical Analysis, formed evening star on the weekly chart rejecting resistance, a signal for resumption for the weekly bearish trend
Technical analysis for the DXY dollar index is showing that the index formed an evening star pattern on the weekly chart, rejecting resistance, and signaling a potential resumption of the…
Read the post
DXY dollar index Technical Analysis, the index reached a strong resistance and started a pullback on the daily chart
Technical analysis for the DXY dollar index is showing that the index reached a strong resistance around 93.00 and almost reached the second target of the daily bullish run at…
Read the post
DXY dollar index – retesting the breakout area, which is now a support zone on the daily chart
Not a lot changed in the past week. After the initial breakout in the daily chart, the price pulled back to retest the breakout. The first target of this breakout…
Read the post
DXY dollar index – broke above previous daily high extending the pullback on the daily chart
The index broke above previous weekly and daily high, extending the pullback on the daily chart. The first target for this daily bullish run is at 1.272 FIB extension around…
Read the post
DXY dollar index retested and rejected the breakout of descending wedge on the weekly chart
The index closed the week with a bullish low-test candle rejecting the breakout of a descending wedge on the weekly chart. The rejection on the weekly chart materialized on the…
Read the post
DXY dollar index – broke below the bearish flag on the 4H chart
The price broke below the bearish flag on the 4H chart and formed Head and Shoulders on the 4H chart. If the price break below 89.92 we will see further…
Read the post
DXY dollar index – technical analysis for 7–13 February 2021
The DXY index is painting a different picture than the FXCM dollar index. The DXY broke above descending wedge on the weekly and the daily charts, and also broke above…
Read the post
DXY dollar index – technical analysis for 2021
Similar to the FXCM dollar index. The index is within its 3rd bearish wave of the bearish trend on the monthly and weekly chart. The first target for the weekly…
Read the post


