|
Getting your Trinity Audio player ready...
|
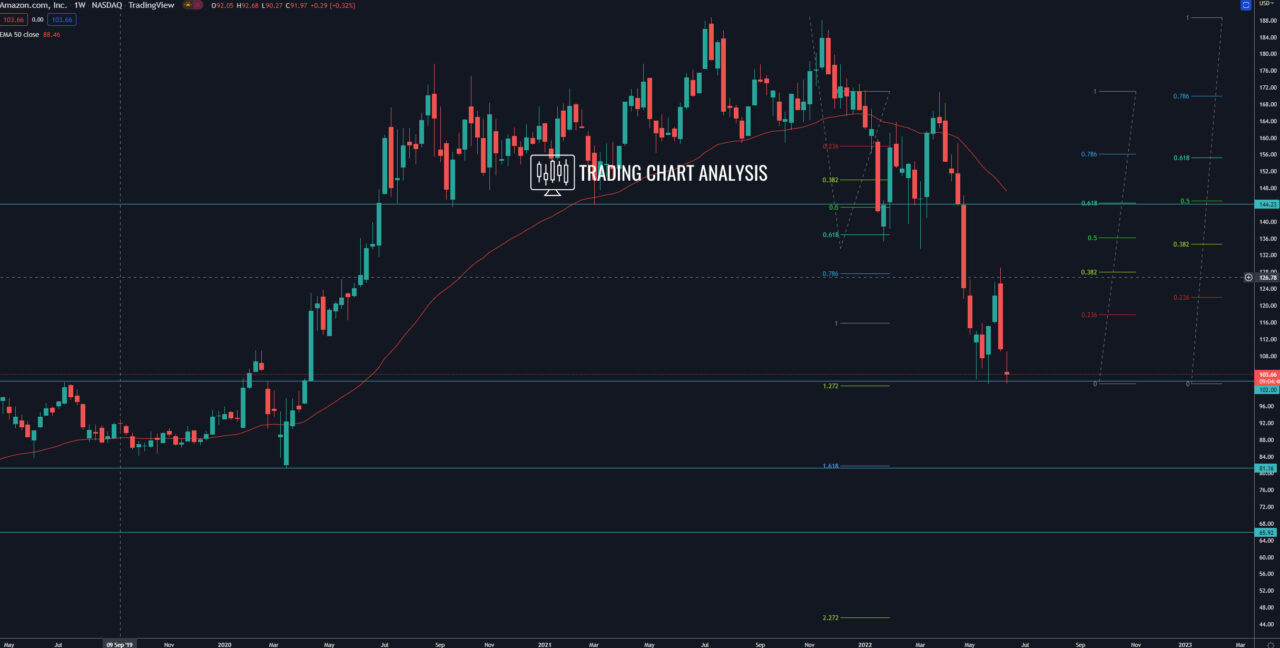
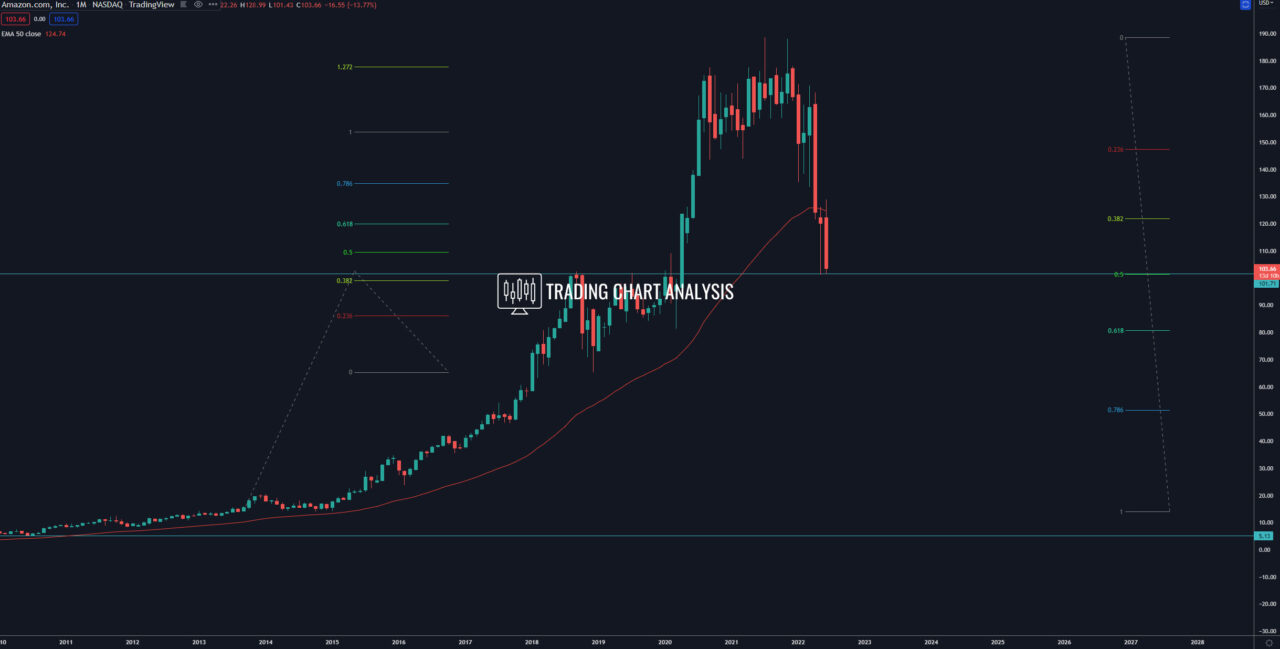
Technical analysis for Amazon (AMZN), the shares of Amazon broke down in April 2022 and started a bearish wave on the weekly chart. The first target of this bearish wave, the 1.272 FIB extension around 100-101$, was reached. The price of the shares went as low as 101.26. The second target for the bearish wave is the 1.618 FIB extension on the weekly chart around 80-81$, which also is the 0.618 FIB on the monthly chart.
A decisive break below 80$ will send the shares of Amazon lower toward first, the December 2018 low at 65.35$. The second target for this potential bearish development is the support from 2017 around 46$, which is the 2.272 FIB extension on the weekly chart.
The high on the daily chart at 129$ is the near-term resistance, and if the shares of Amazon (AMZN) break above 129$, that will open the door for a bullish run toward the resistance and 0.618 FIB retracement on the weekly chart at 144-145$.
Weekly chart:

Monthly chart:


