|
Getting your Trinity Audio player ready...
|
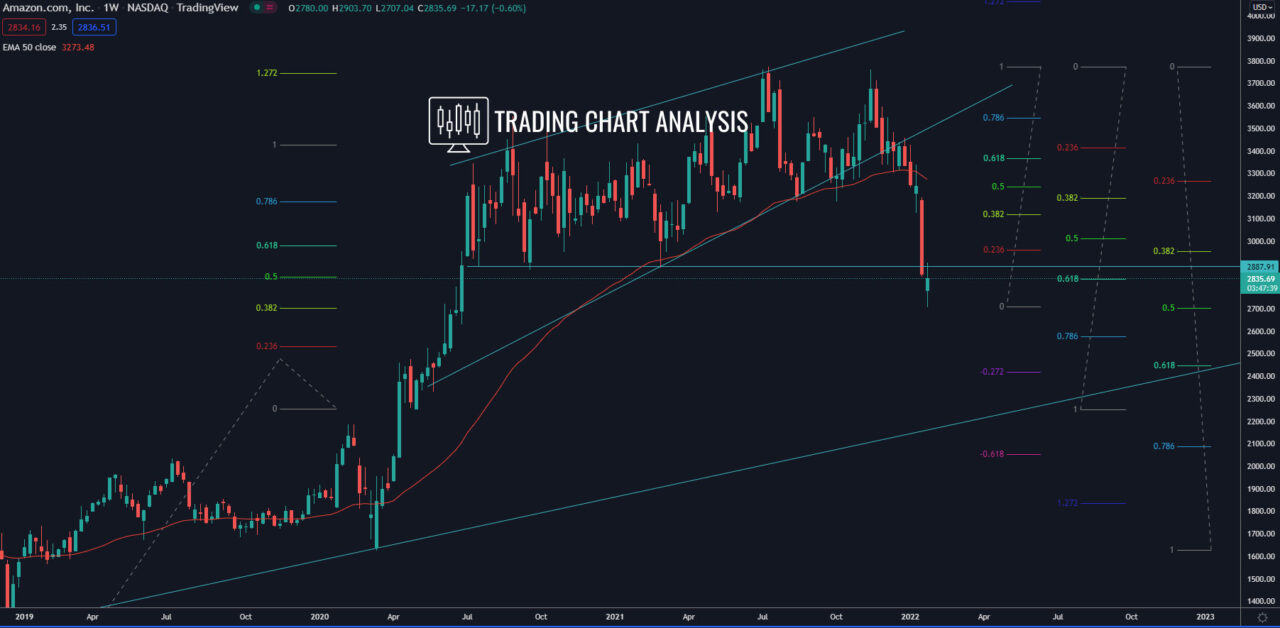
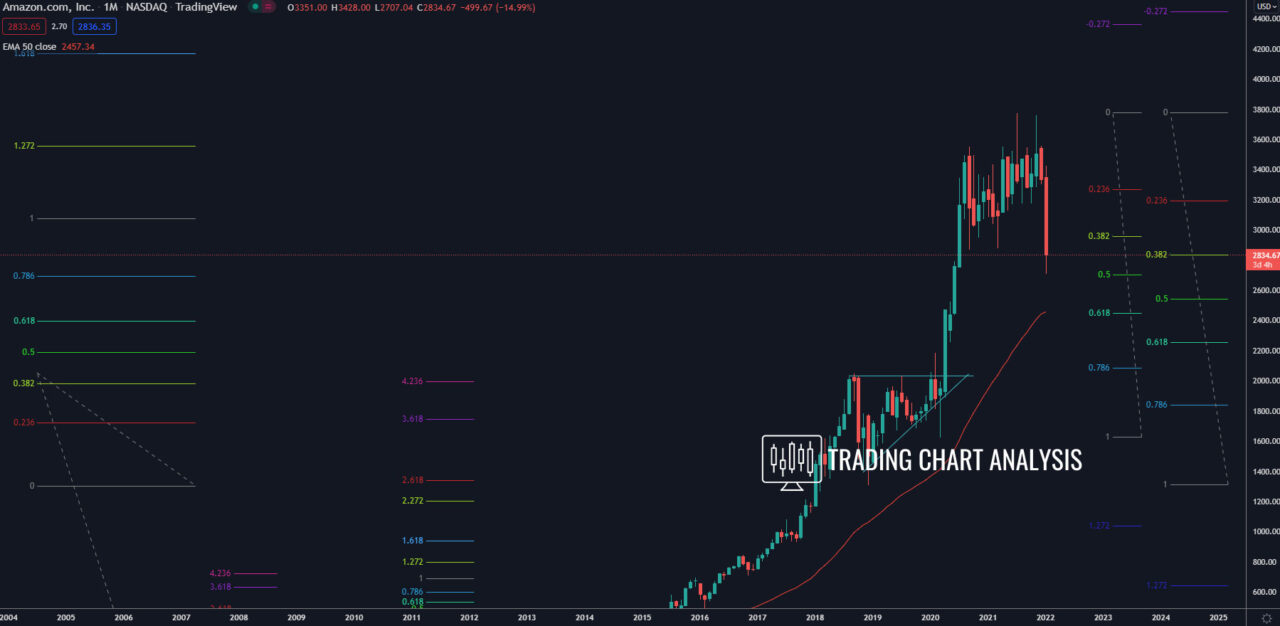
Technical analysis for Amazon(AMZN), the price formed a double top on the monthly, weekly, and daily charts and started a pullback. The first target of this pullback, the 0.382 FIB extension on the weekly chart at 3190$, was reached. The second target, the 0.382 FIB extension on the monthly chart at 2950$, was reached. The third target, the 0.618 FIB extension on the weekly chart at 2830$, was also hit. The shares of Amazon are trading around the 0.618 FIB retracement on the weekly chart at 2830$, awaiting the latest Amazon(AMZN) earnings report, which will be released on Wednesday the third of February 2022. If the shares of Amazon(AMZN) started trading and holding below 2830$, that will open the door for a bearish run toward the 0.618 FIB retracement on the monthly chart at 2450$.
Looking at the bigger picture, on the quarterly chart, the shares of Amazon(AMZN) reached the third target of the fifth bullish wave, the 1.272 FIB extension around 3555$. The fourth target of that bullish wave is the 1.618 FIB extension at 4150$.
On the weekly chart, the shares of Amazon(AMZN) hit the first target of the latest bullish wave, the 1.272 FIB extension at 3750$. The second target of that bullish wave on the weekly chart is the 1.618 FIB extension at 4150$, which matches the last target for the fifth bullish wave on the quarterly chart.
Weekly chart:

Monthly chart:


