|
Getting your Trinity Audio player ready...
|
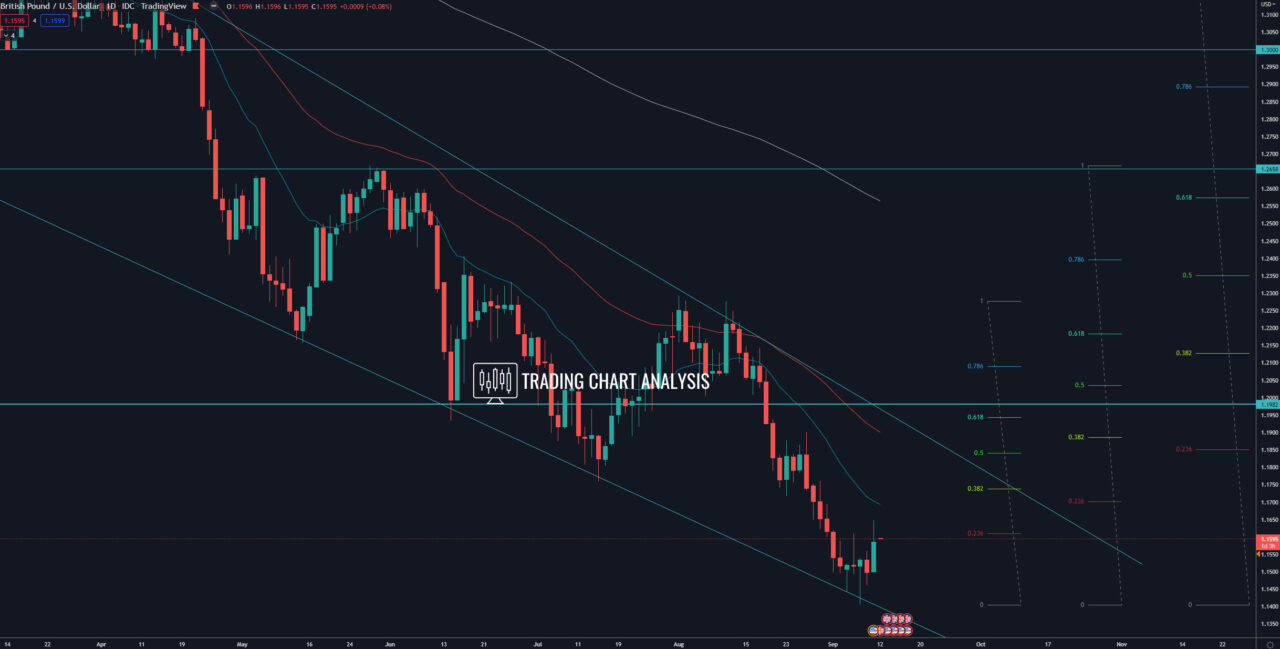
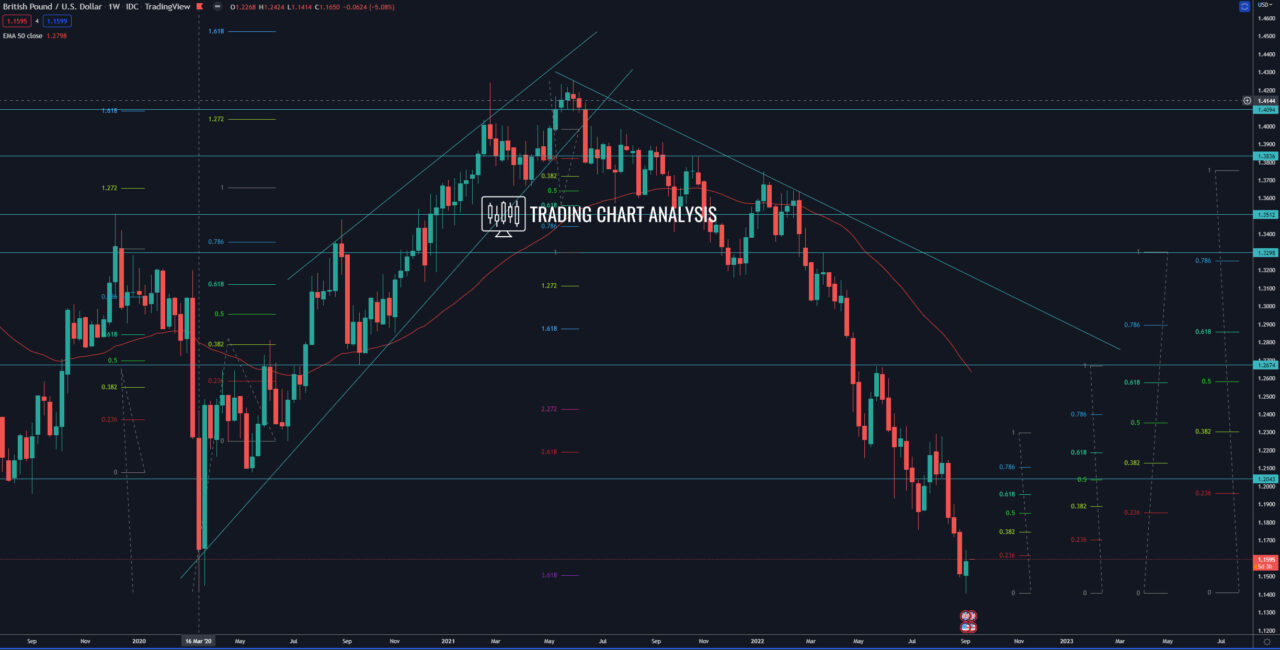
Technical analysis for GBP/USD, the pair formed a low-test pattern on the weekly and the daily charts, rejecting the 2020 low, signaling the begging of a bounce. The first target for this pullback is the 0.382 FIB retracement on the daily chart at 1.1735. The second target is 0.500 FIB retracement on the daily chart at 1.1840. The third target is the 0.618 FIB retracement on the daily chart at 1.1945. And the fourth target for the pullback in the GBP/USD is the 0.786 FIB retracement on the daily chart around 1.2100.
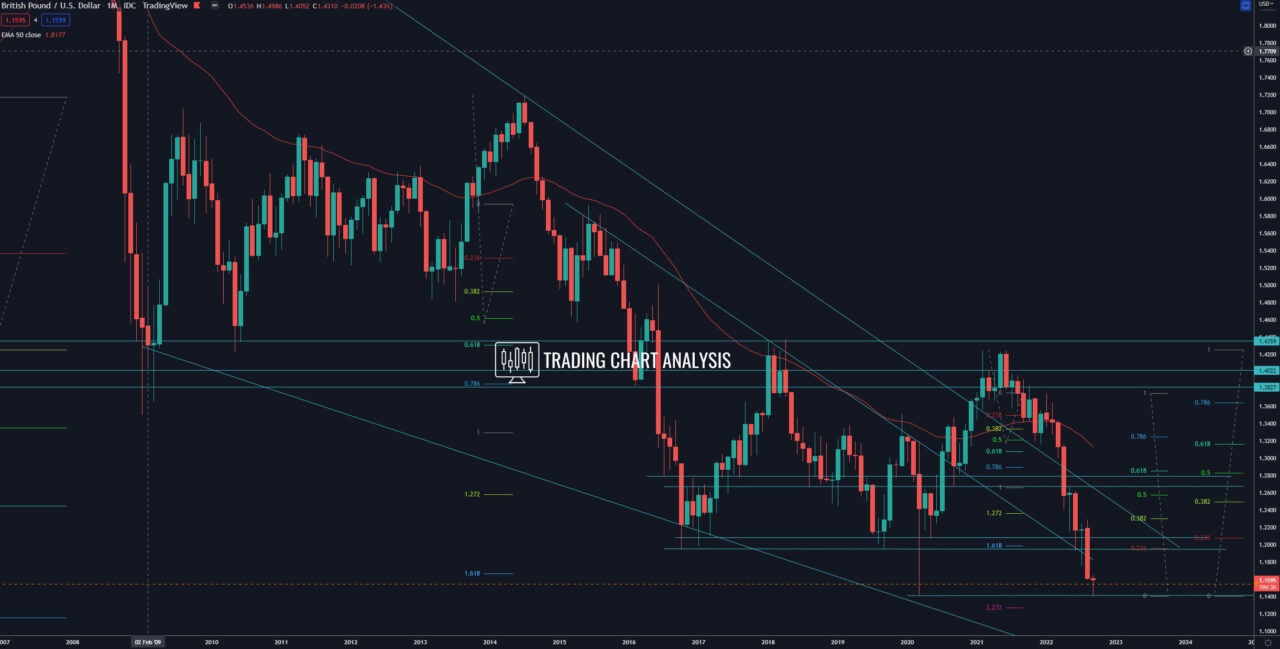
Looking at the bigger picture, on the monthly chart, the GBP/USD closed below the double bottom and support at 1.1950, breaking below the range that has been forming since 2016. This is significant and quite bearish for the GBP/USD. The focus now is on the support at 1.1414, a break below that will extend the bearish wave on the weekly chart. The third target of this bearish wave for the GBP/USD is the 1.272 FIB extension on the weekly chart at 1.1270. The fourth target is the 2.618 FIB extension at 1.0880.
Daily chart:

Weekly chart:

Monthly chart:


