|
Getting your Trinity Audio player ready...
|
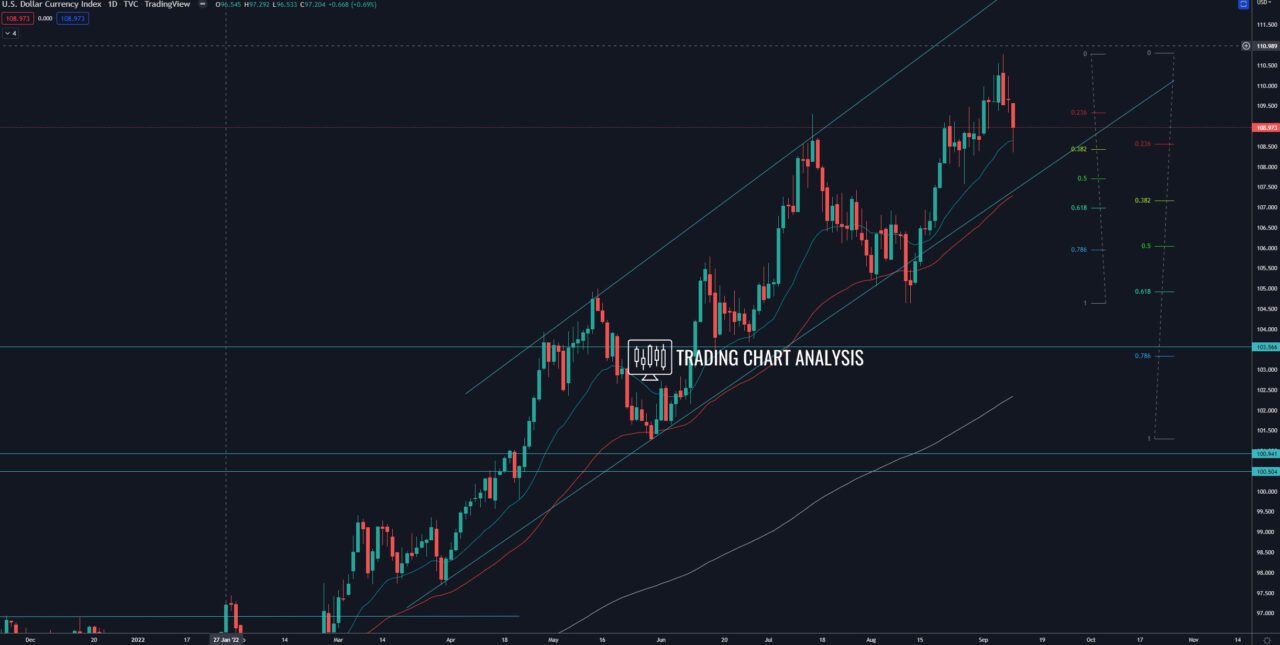
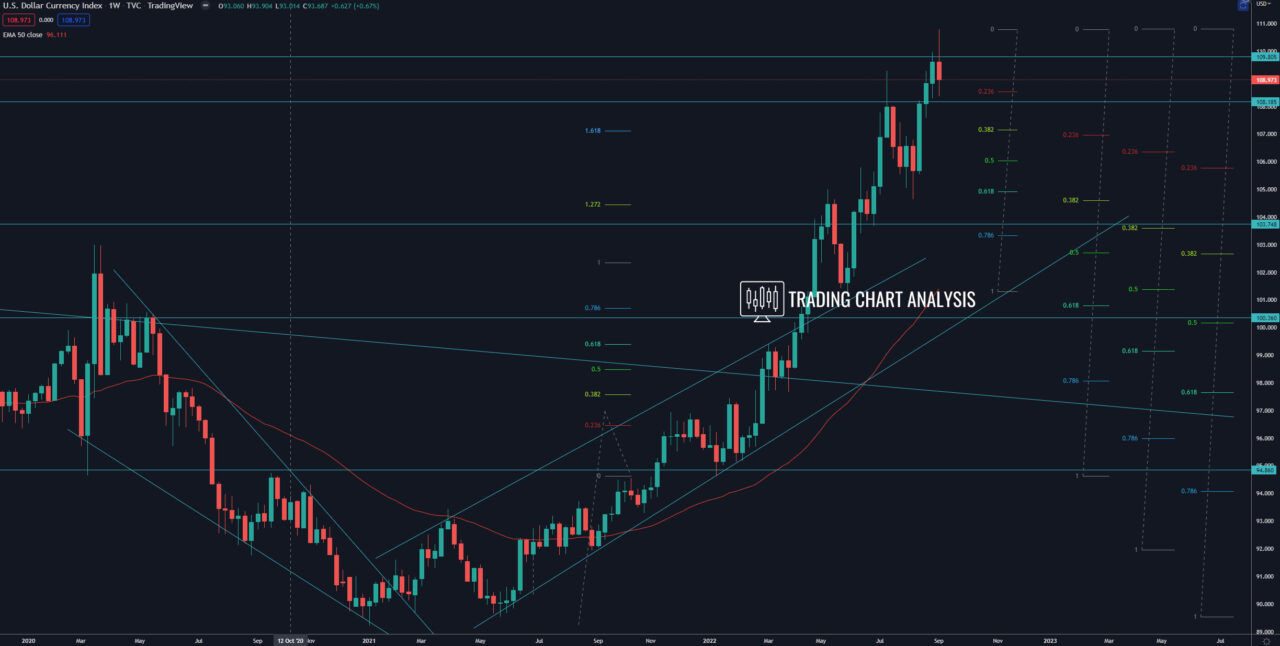
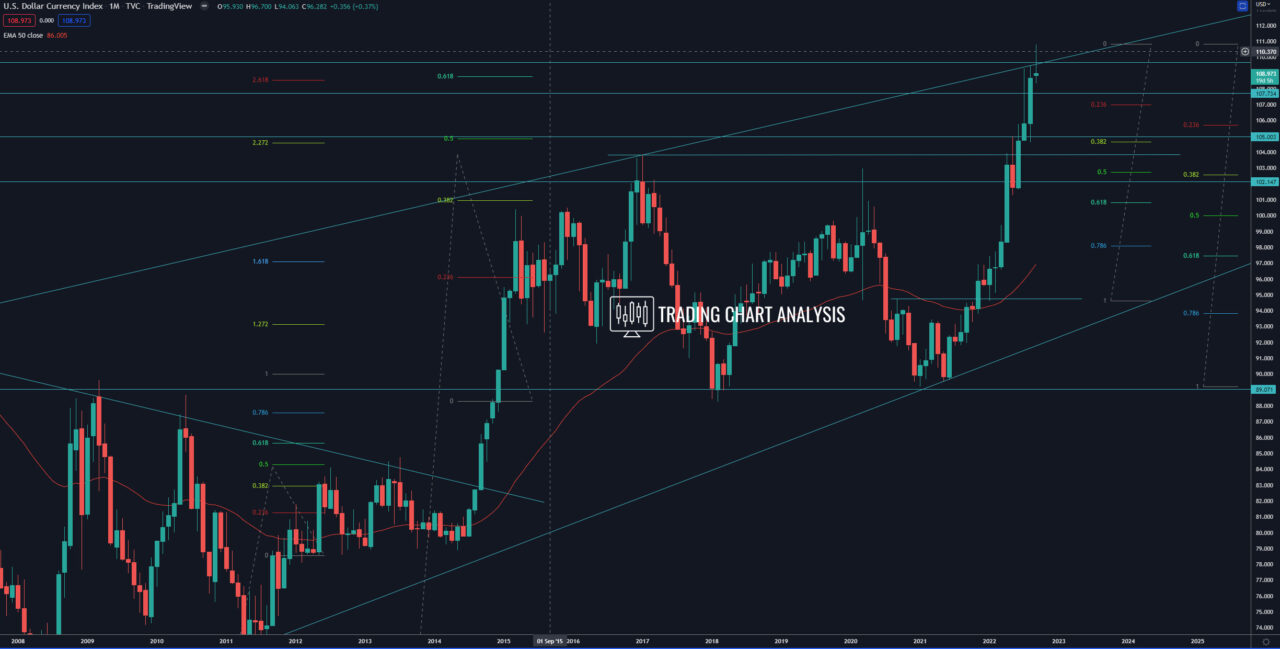
Technical analysis for the DXY, the index rejected resistance and 0.786 FIB retracement on the monthly chart at 109.80 with a bearish inside bar on the weekly chart and Head & Shoulder pattern on the four-hour chart, starting a pullback. The first target for this pullback, the 0.382 FIB retracement at 108.40, was reached. The second target is the low on the daily chart at 107.58. The third target is the 0.618 FIB retracement on the daily chart at 107.00. And the fourth target for the pullback in the DXY index is the support zone between 104.63 – 105.00.
On the other hand, if the DXY index closes above the resistance zone between 109.80-110.00 on the weekly chart, that will extend the bullish wave. The third target of this bullish wave on the weekly chart is the 2.272 FIB extension at 112.20. The fourth target is the 2.618 FIB extension on the weekly chart at 114.85.
Daily chart:

Weekly chart:

Monthly chart:


