|
Getting your Trinity Audio player ready...
|
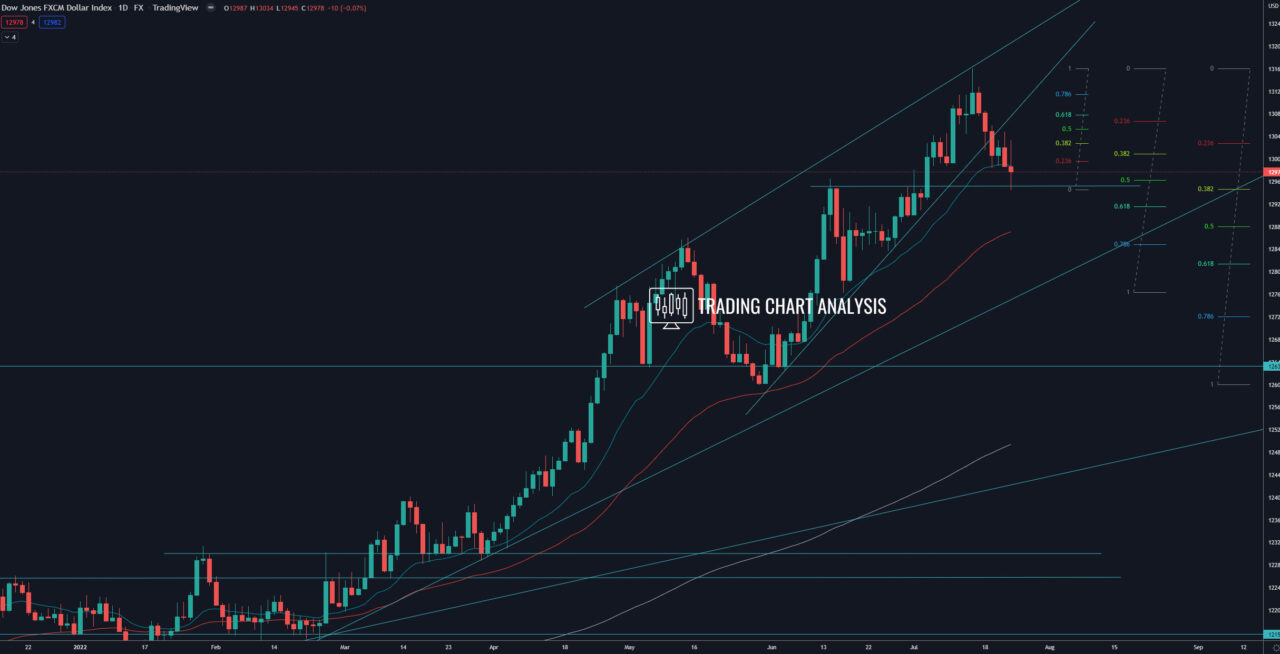
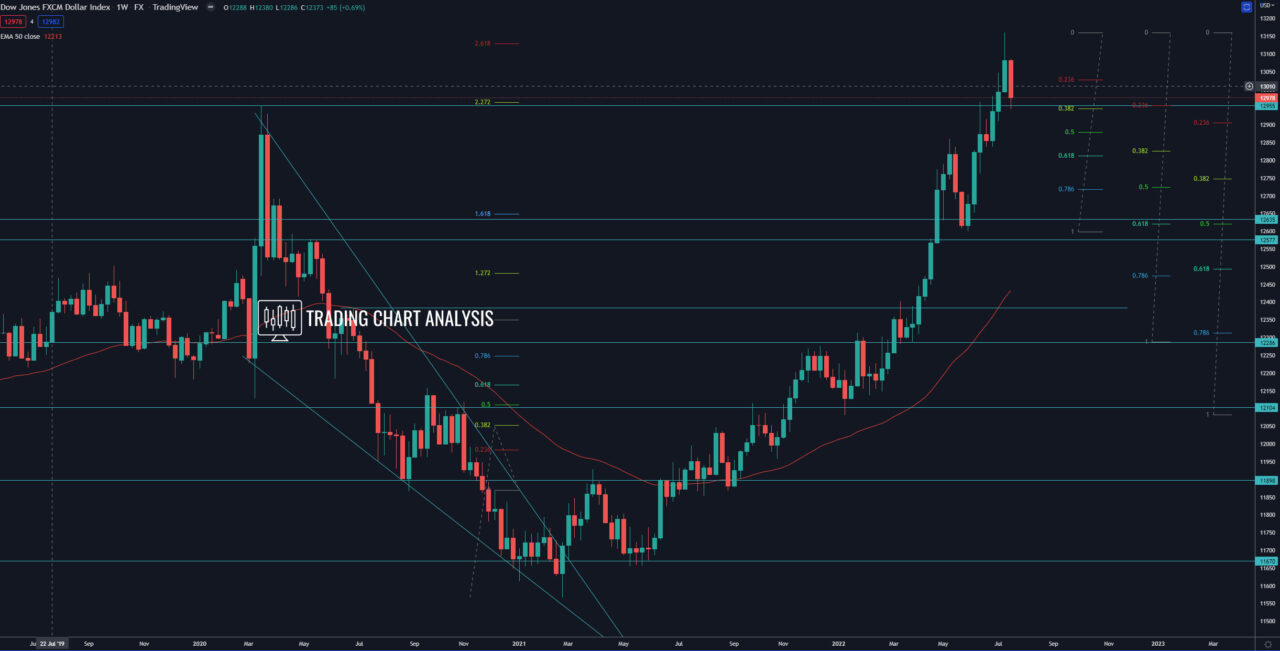
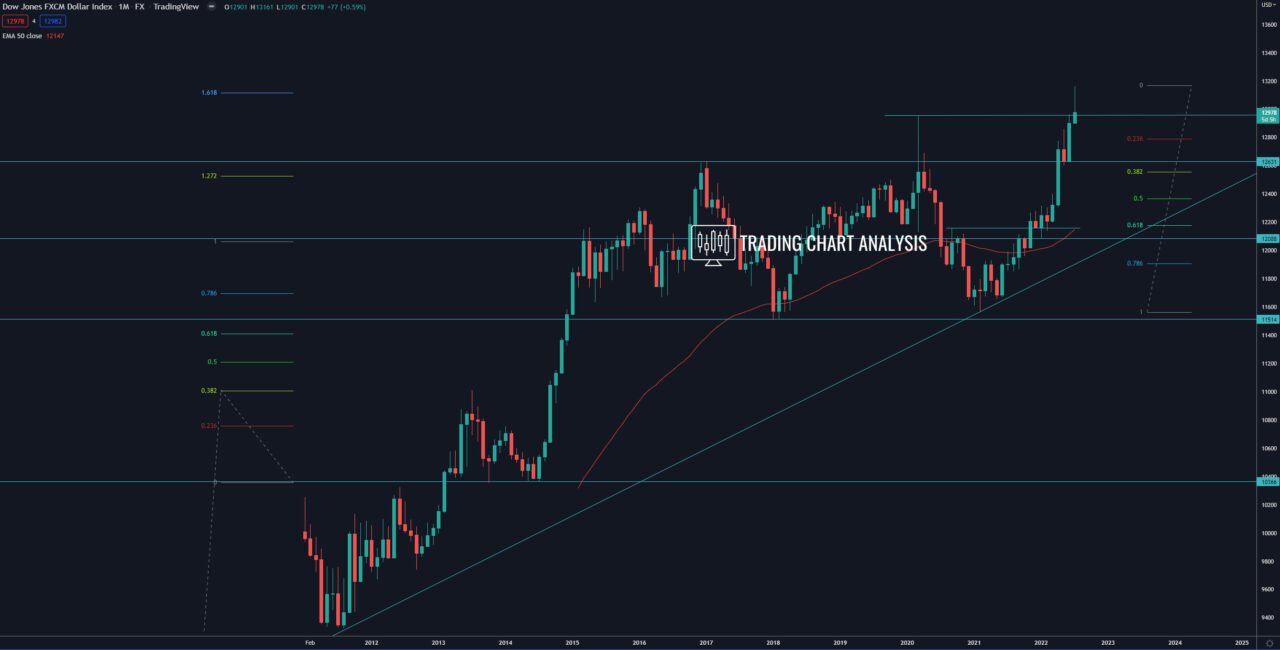
Technical analysis for the FXCM dollar index, the index reached the second target of the bullish wave on the monthly chart, the 1.618 FIB extension at 13 120. On the weekly chart, the FXCM dollar index also reached the fourth target of the bullish wave, the 2.618 FIB extension at 13 130, and rejected it with a bearish engulfing candle, starting a pullback. On the daily chart, the index broke below ascending wedge, confirming the reversal picture. The first target for the pullback, the 0.382 FIB retracement on the weekly chart at 12 945, was reached. The second target is the 0.618 FIB retracement on the weekly chart at 12 815, but before that, we need to see the dollar index breaking below the support at 12 945. The third target for the pullback in the dollar index is the support and the previous low on the weekly chart around 12 600.
On the other hand, if the FXCM dollar index closes above the 0.382 FIB retracement on the daily chart at 13 030, that will push the index higher toward the 0.618 FIB retracement at 13 080. And a close above 0.618 FIB retracement on the daily chart will open the door for a retest of the previous high at 13 161.
Daily chart:

Weekly chart:

Monthly chart:


