|
Getting your Trinity Audio player ready...
|
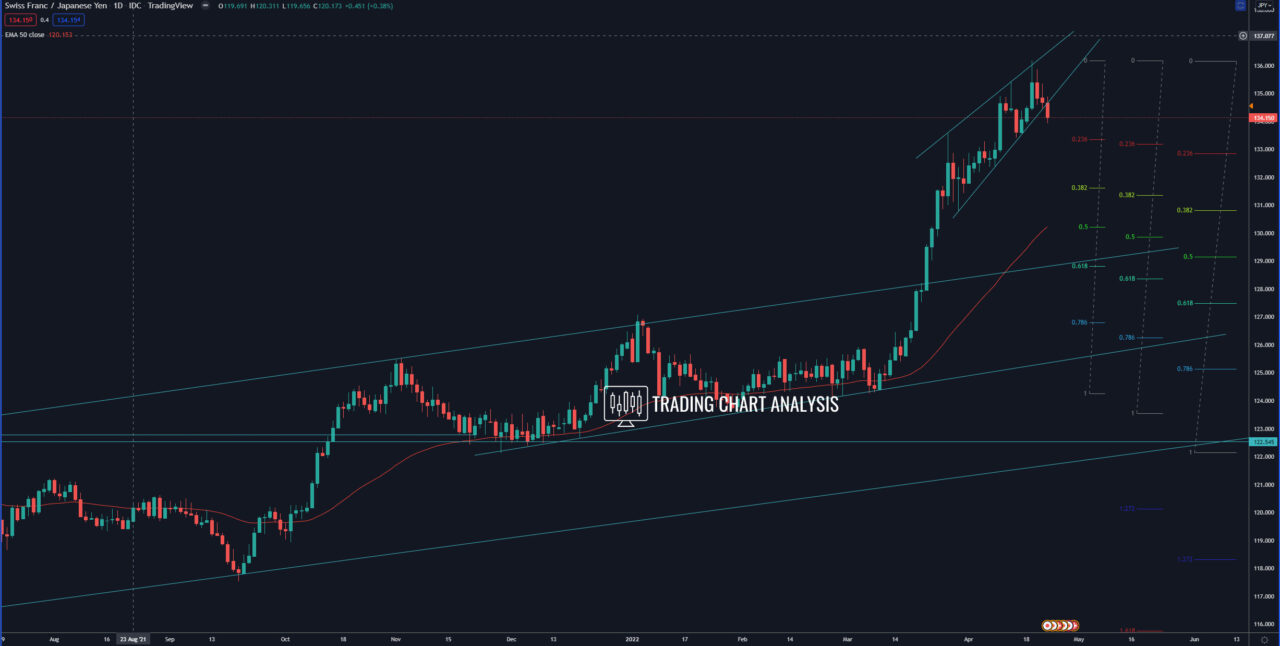
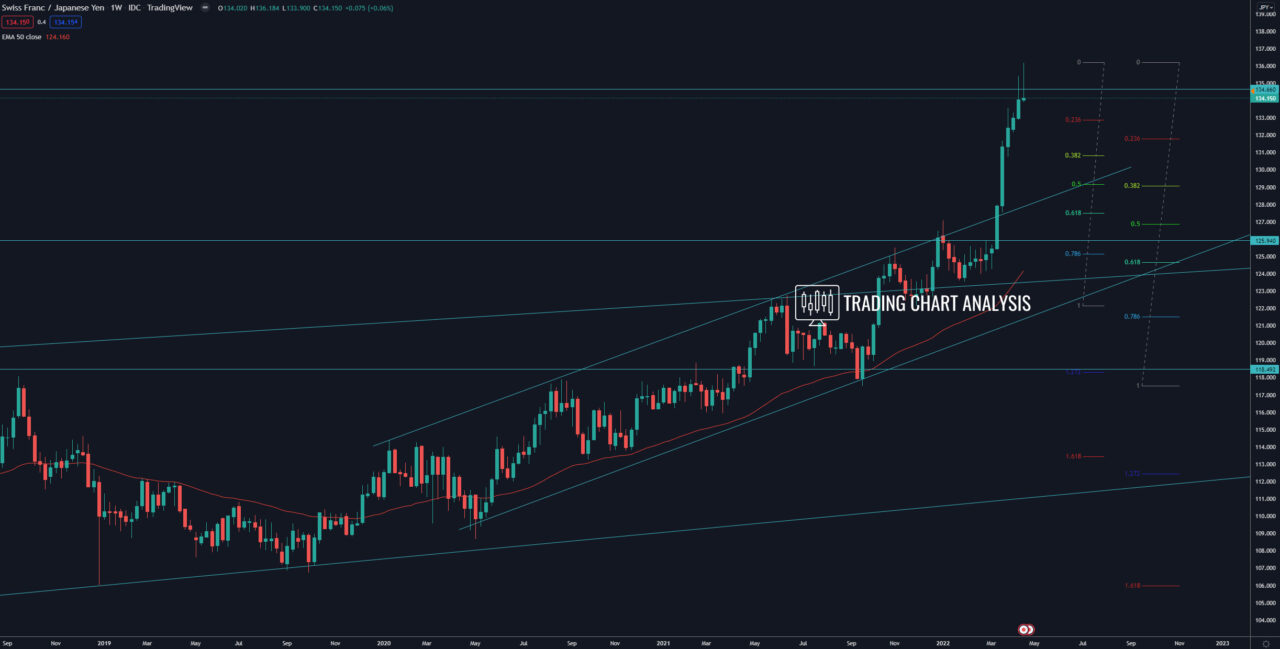
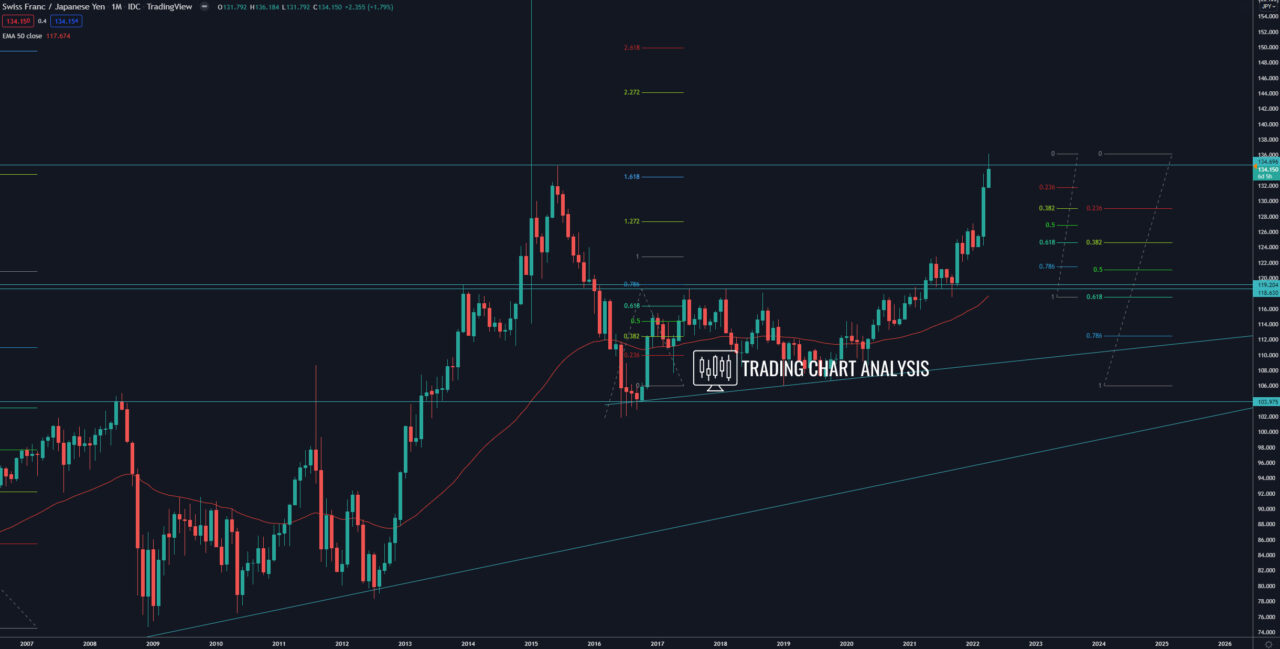
Technical analysis for CHF/JPY, the price reached the second target of the bullish wave on the monthly chart, the 1.618 FIB extension at 133.15 and the previous high at 134.61, and rejected it, starting a pullback. On the weekly chart, the CHF/JPY rejected the high at 134.61 with a high-test candle. On the daily chart, the price broke below ascending wedge, confirming the potential pullback on the weekly chart. The first target for this pullback is the previous low and support on the daily chart at 133.42. The second target of the potential pullback on the CHF/JPY is the 0.382 FIB retracement on the daily chart at 131.65. The third target is the 0.382 FIB retracement on the weekly chart at 130.85, where we have the low and support on the daily chart.
The resistance zone between 134.85 and 135.35 will be watched by the traders for selling pressure and potential decline in the price of CHF/JPY.
Daily chart:

Weekly chart:

Monthly chart:


