|
Getting your Trinity Audio player ready...
|
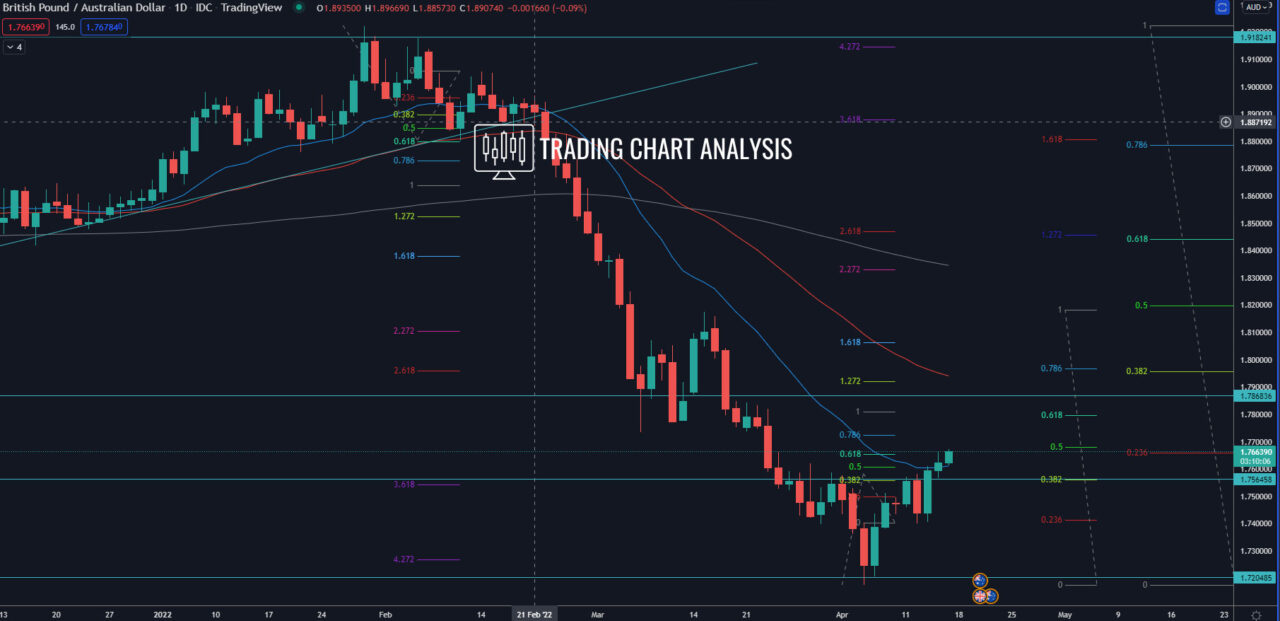
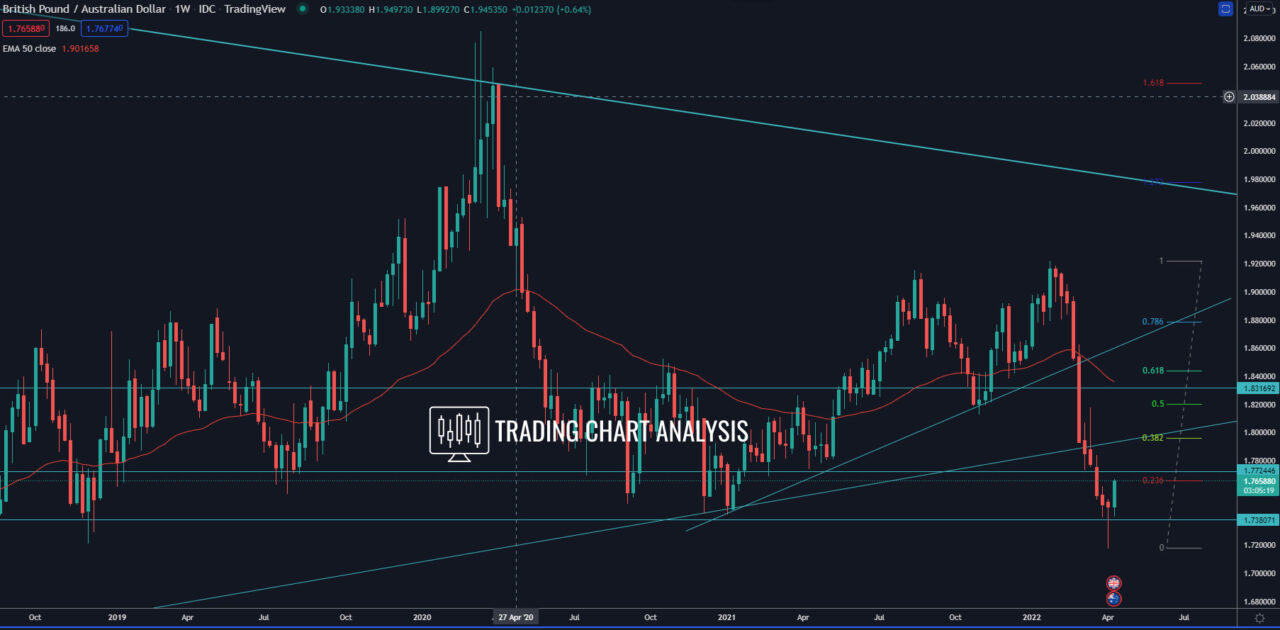
Technical analysis for the GBP/AUD, the pair formed a morning star pattern on the weekly chart bouncing from strong support, signaling a pullback on the weekly chart. The pair also broke above the neckline of the Head & Shoulders pattern on the daily chart, starting a bullish run on the daily chart. The first target for this bullish run is the 1.272 FIB extension on the daily chart at 1.7920, where we have the daily 50 EMA and the 0.382 FIB retracement on the weekly chart. The second target is the 1.618 FIB extension on the daily chart at 1.8060. The third target for the bullish run for the GBP/AUD is the 2.272 FIB extension on the daily chart at 1.8330. The fourth target is the 0.618 FIB retracement on the weekly chart at 1.8440.
On the other hand, if the GBP/AUD breaks below the low at 1.7400, it will send the price low toward the previous daily low at 1.7175. And if the GBP/AUD breaks below the 1.7175, that will have significant bearish implications for the GBP/AUD. The first target for such a bearish development in case of a break below 1.7175 is the 0.786 FIB retracement on the monthly chart at 1.6780. The second is the support zone between 1.6250 and 1.6150 on the weekly chart.
Daily chart:

Weekly chart:


