|
Getting your Trinity Audio player ready...
|
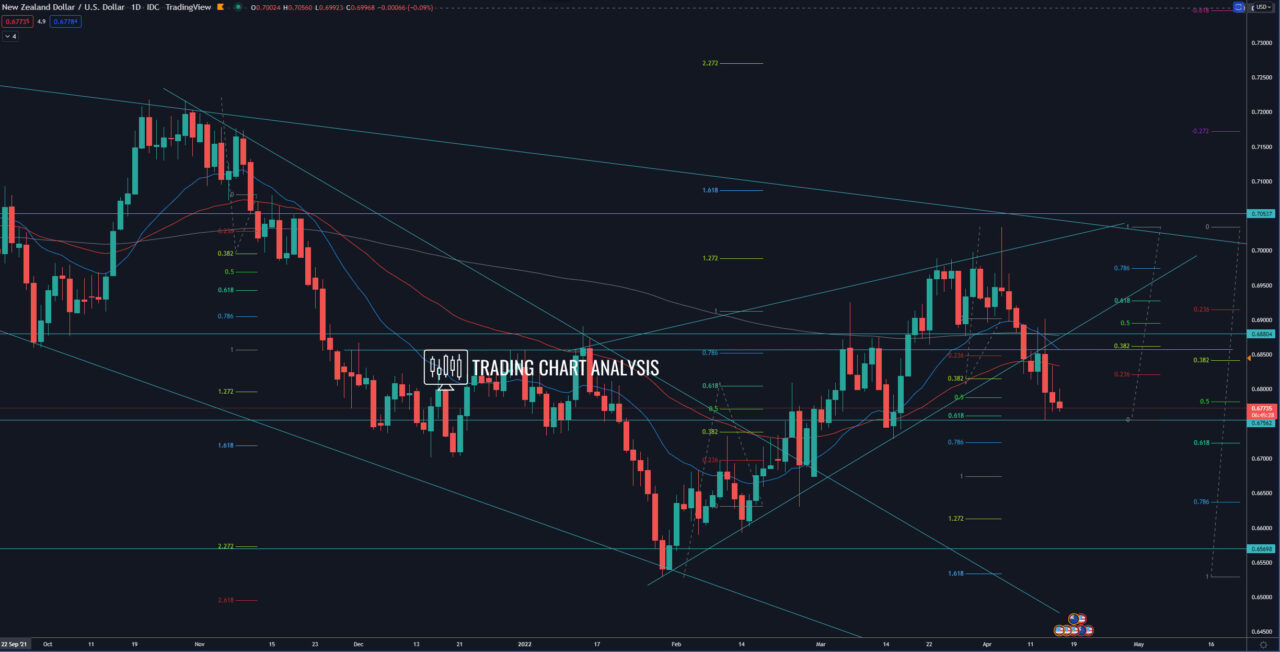
Technical analysis for NZD/USD, the price broke below ascending trend line on the daily chart, which is a signal for further declines. The first target for this breakout is the daily low at 0.6729, where we have the 0.618 FIB retracement. If the NZD/USD breaks below 0.6720, it will extend the bearish run toward the second target at the 0.786 FIB retracement on the weekly chart and the low at 0.6630. The third target for the decline in NZD/USD is the 1.618 FIB extension on the daily chart and the previous low at 0.6530.
On the other hand, if the NZD/USD breaks above the previous high at 0.6901, that will be a signal for another bullish run toward the resistance zone between 0.7000 and 0.7034
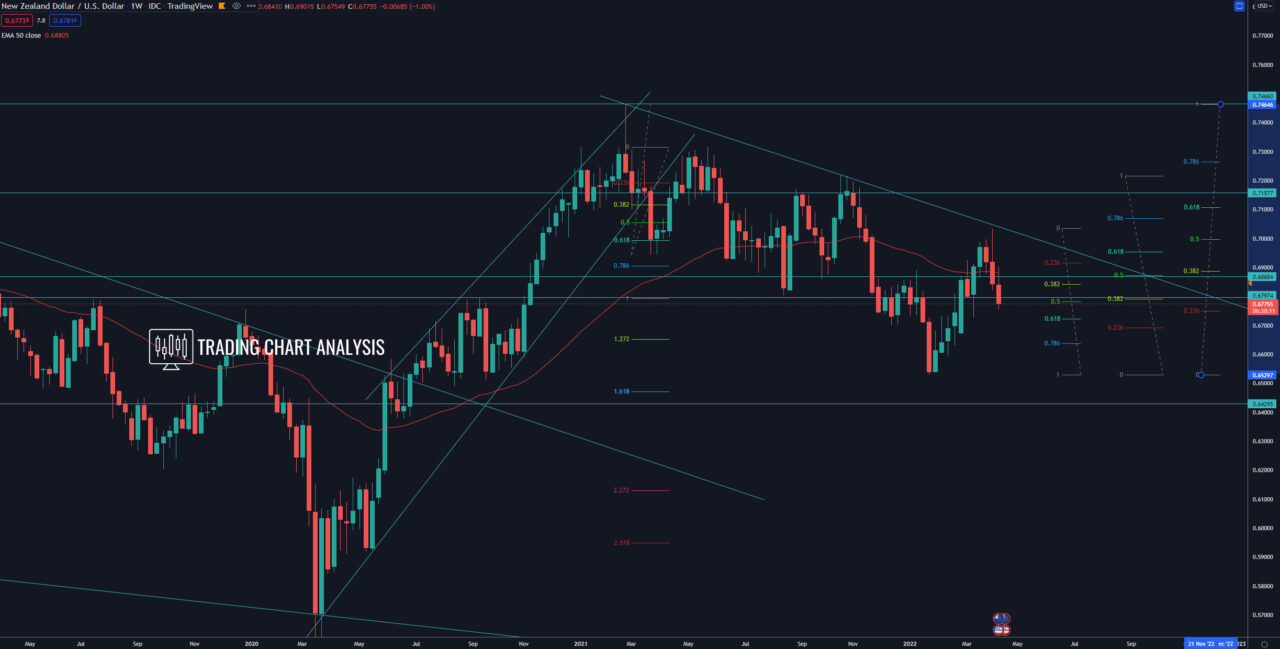
Looking at the bigger picture, the bearish wave on the weekly chart, which started after the break below the low at 0.6943, has not concluded yet. The second target for the bearish weekly wave for the NZD/USD is the 1.618 FIB extension at 0.6470, where we have the 0.500 FIB retracement on the monthly chart. Break below the daily low at 0.6729 will signal the resumption of the bearish wave for the NZD/USD.
Daily chart:

Weekly chart:


