|
Getting your Trinity Audio player ready...
|
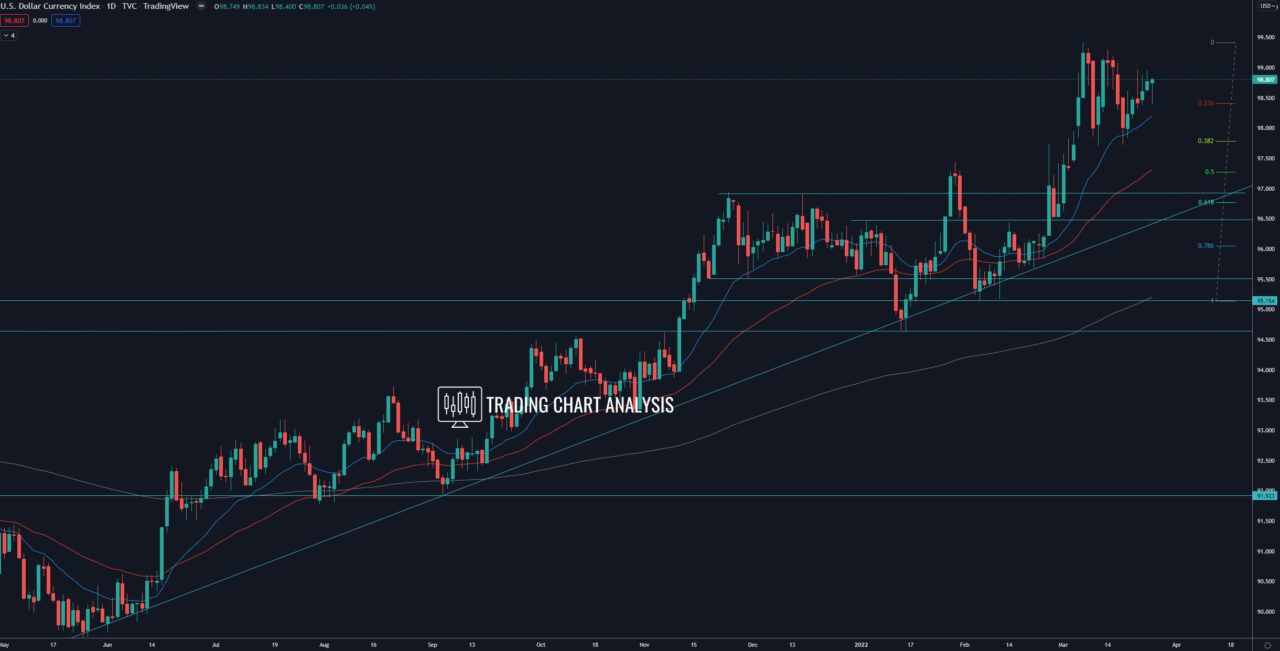
Technical analysis for the DXY dollar index, the index is holding the low and 0.382 FIB retracement on the daily chart around 97.75. If the DXY index breaks below the low at 97.71, that will open the door for a bearish run toward the 0.618 FIB retracement on the daily chart and the 0.382 FIB retracement on the weekly chart around 96.80.
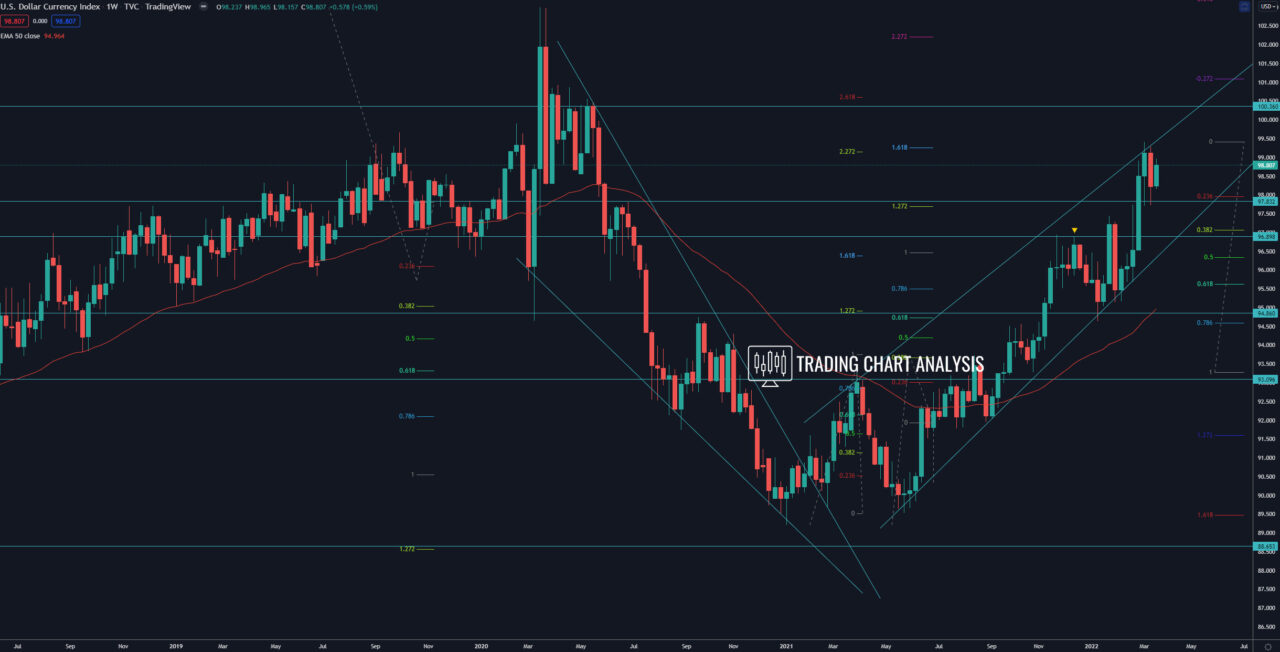
The DXY index is within a bullish wave on the weekly chart and reached the third target of the wave, the 1.618 FIB extension at 99.25. If the DXY dollar index breaks above 99.25, it will send the index higher toward the resistance zone between 100.40-90. And if the DXY dollar index breaks above 100.90, it will open the door for a bullish run toward the 2.72 FIB extension on the weekly chart at 102.25.
Daily chart:

Weekly chart:


