|
Getting your Trinity Audio player ready...
|
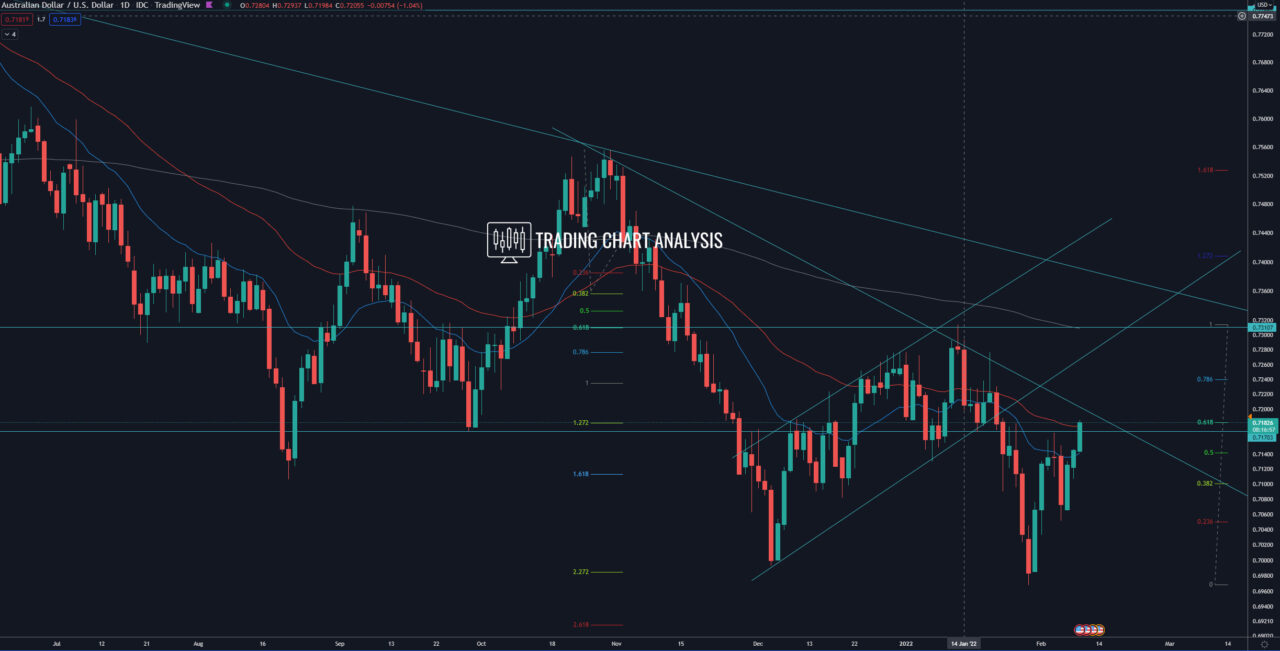
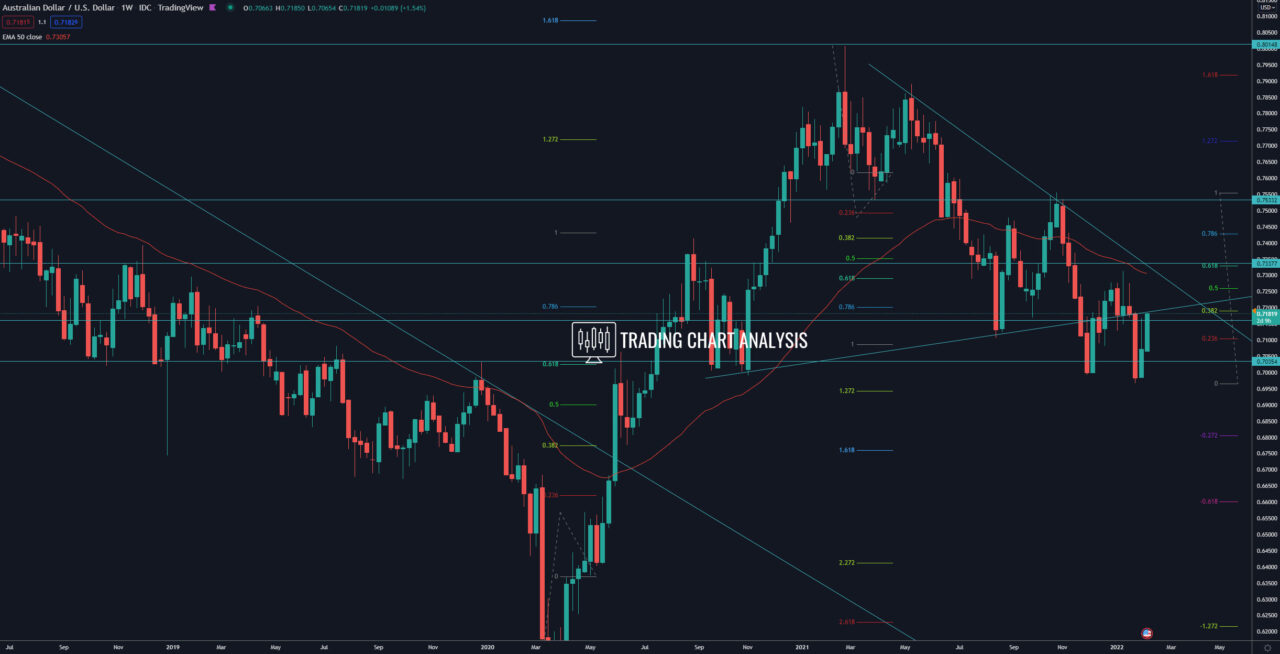
Technical analysis for AUD/USD, the pair is approaching a strong resistance zone. Between 0.7185-0.7200, we have the daily 50 EMA, descending trend line, 0.382 FIB retracement on the weekly chart, and 0.618 FIB retracement on the daily chart. If the AUD/USD breaks above this resistance zone, above 0.7200, that will open the door for a bullish run. The first target for this potential bullish breakout is the 0.500 FIB retracement on the weekly chart at 0.7260. The second target is the weekly 50 EMA and the high at 0.7316. Furthermore, in this scenario, we may see a pullback on the monthly chart toward the 0.382 FIB retracement at 0.7360.
On the other hand, if the AUD/USD breaks below the low at 0.7050, that will send the price lower to test the low at 0.6967.
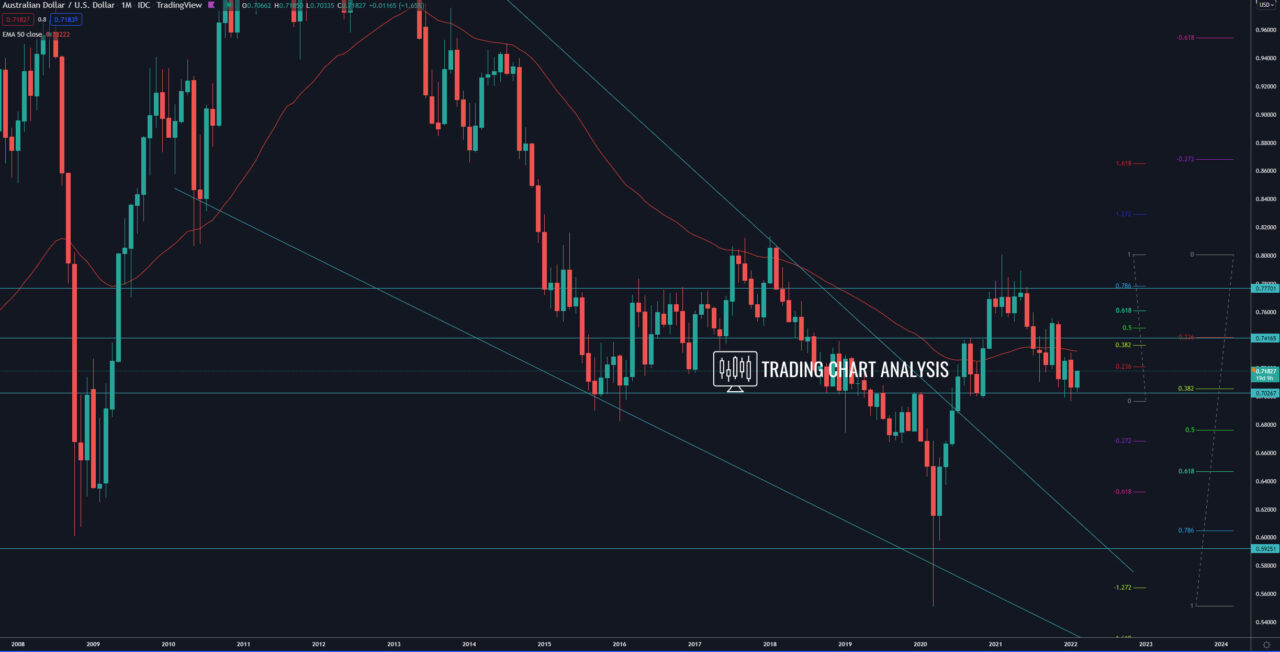
On the monthly chart, the AUD/USD is holding above the support zone between 0.6990 – 0.7050, where we have 0.382 FIB retracement at 0.7050 and the low at 0.6991. If the AUD/USD close below that zone on the monthly chart, that will open the door for a bearish run toward the 0.500 FIB retracement on the monthly chart at 0.6760.
Daily chart:

Weekly chart:

Monthly chart:


