|
Getting your Trinity Audio player ready...
|
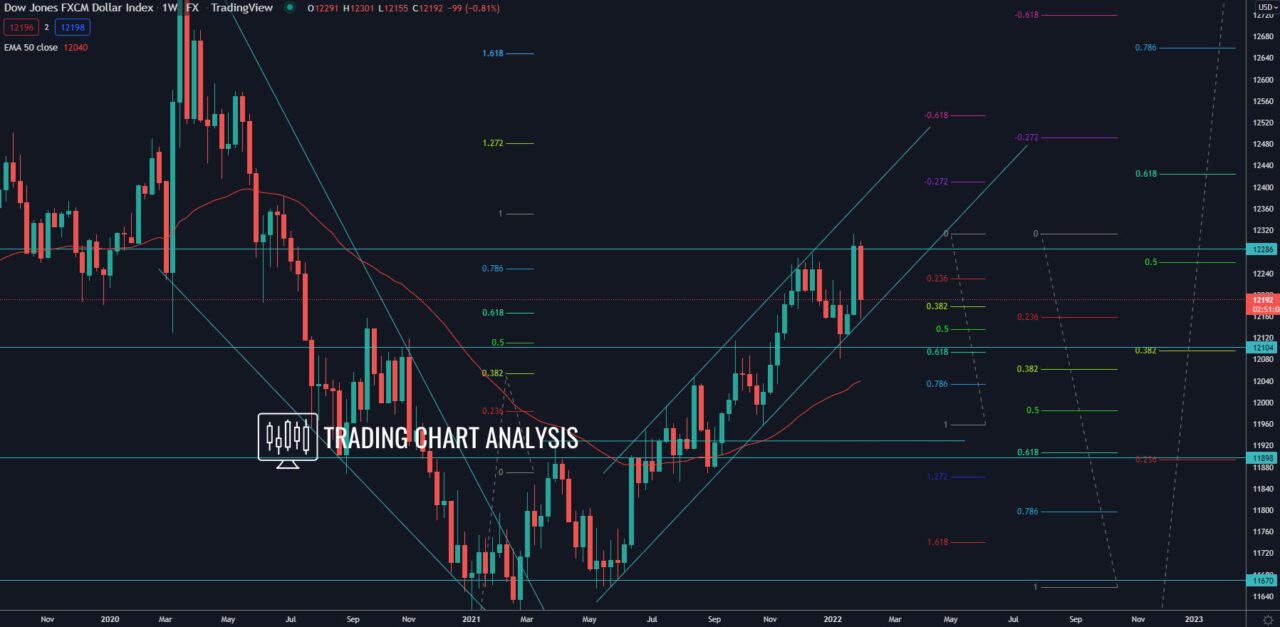
Technical analysis for the FXCM dollar index, the price closed the week with a bearish inside candle, starting a pullback. The first target for this pullback, the 0.382 on the weekly chart at 12 178, was reached. The FXCM dollar index went as low as 12 155 and bounced from ascending trend line and support. If the index break below last week’s low at 12 155, it will open the door for a bearish run toward the 0.618 FIB retracement on the weekly chart at 12 095.
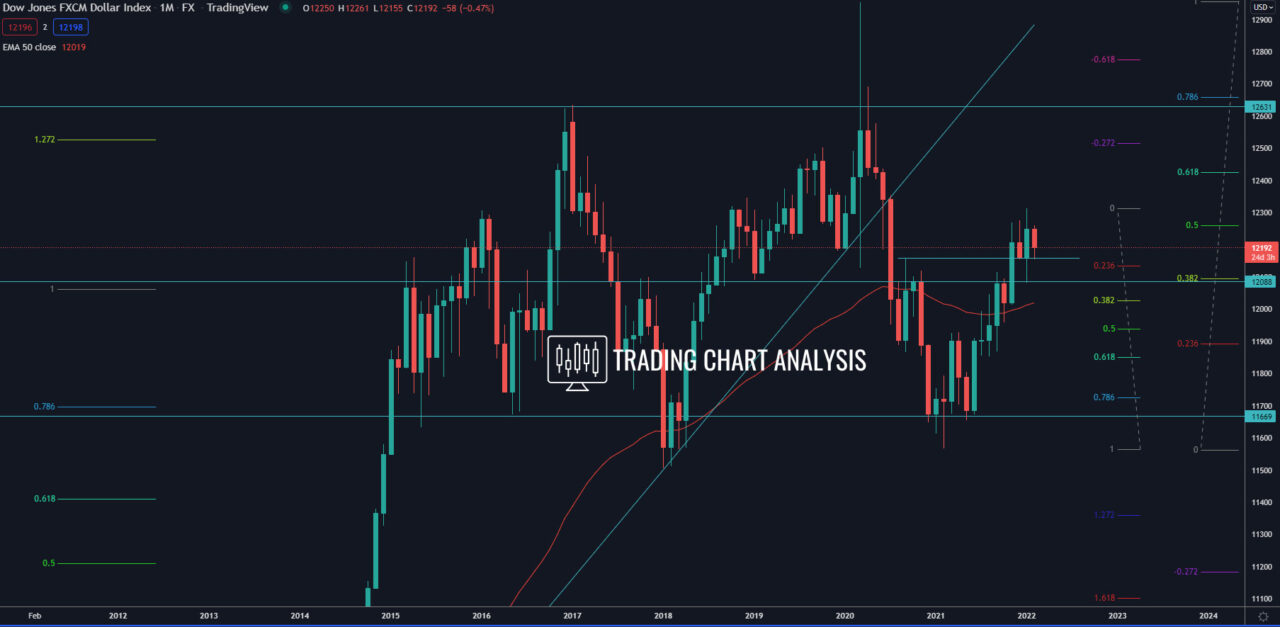
Looking at the bigger picture, on the monthly chart, the FXCM dollar index broke above the high at 12 158, formed in September 2020. This bullish break opened the door for a bullish run toward the 0.618 FIB retracement at 12 425. The FXCM dollar index is on its way toward that target.
Daily chart:

Monthly chart:


