|
Getting your Trinity Audio player ready...
|
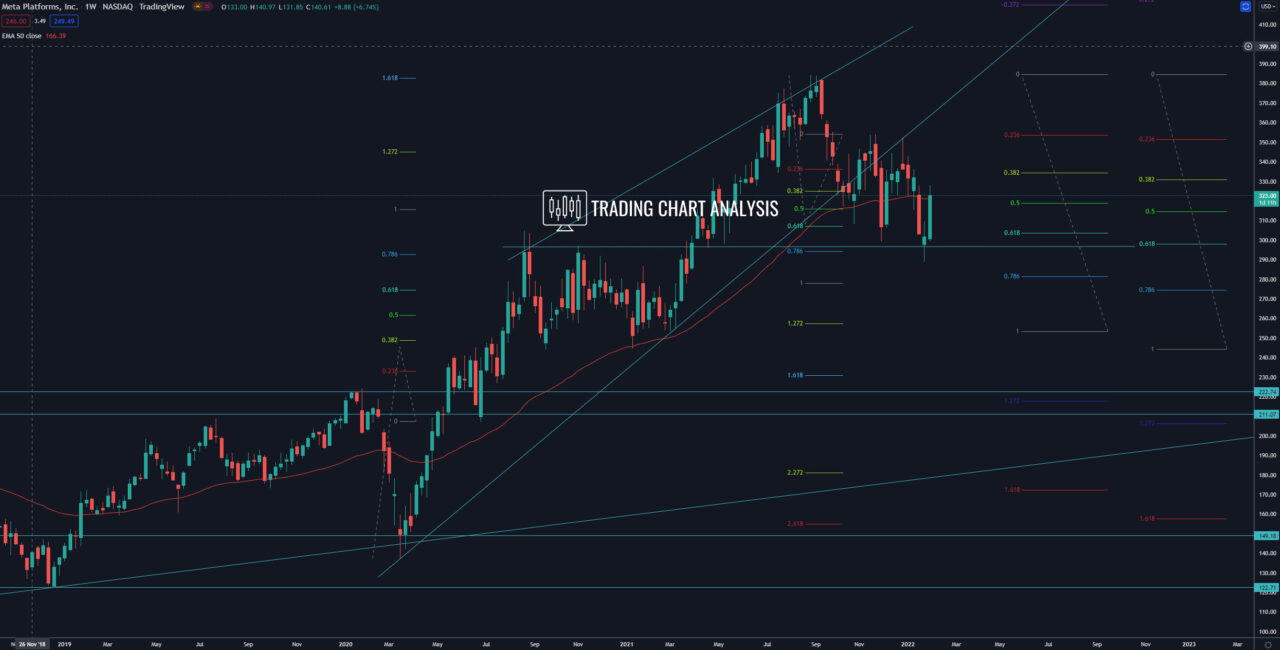
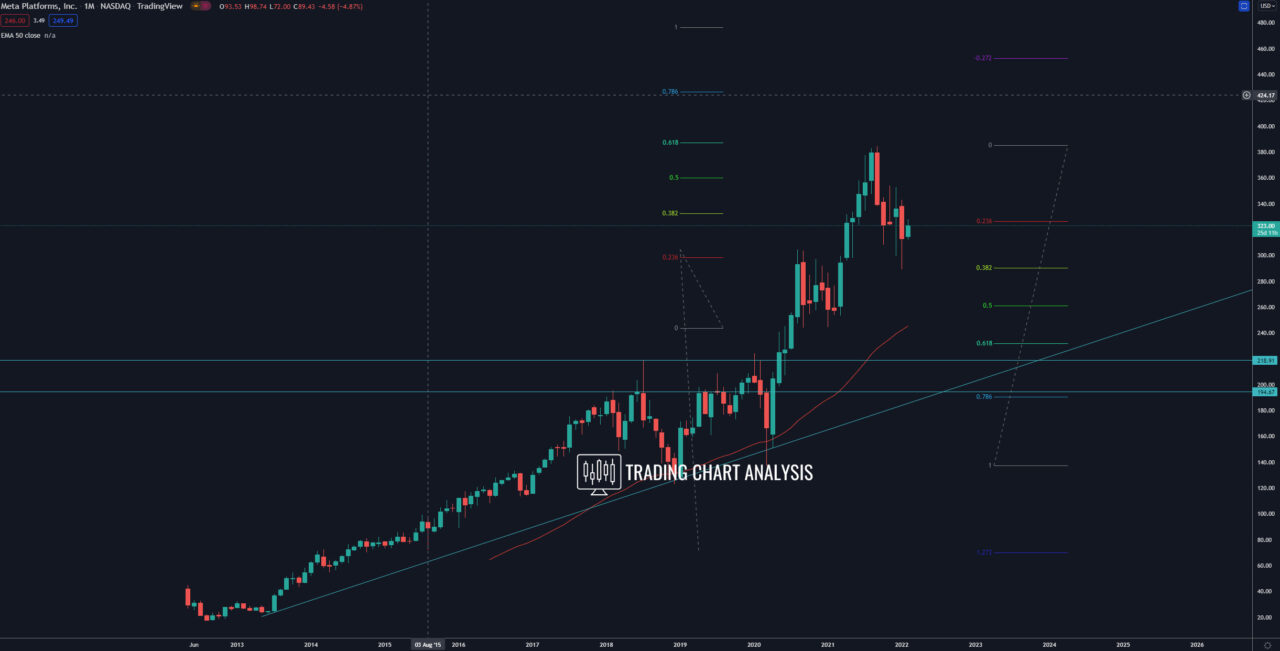
Technical analysis for Meta Platforms (Facebook/FB), the shares reached the second target of the bullish wave on the weekly chart, the 1.618 FIB extension at 382$. That was close to the second target for the fifth bullish wave on the monthly chart at 0.618 FIB extension at 387$.
The shares of Meta Platforms (Facebook/FB) broke below ascending trend line on the weekly chart and below the low at 308.11$, starting a pullback. The first target for this pullback, the 0.382 FIB retracement on the monthly chart at 290$, was reached. The second target for this pullback is the 1.272 FIB extension on the weekly chart at 257$. The third target for this pullback is the 0.618 FIB retracement on the monthly chart at 231$, which is the 1.618 FIB extension on the weekly chart. And if the shares of Meta Platforms break below 231$, that will open the door for a bearish run toward the fourth target of the bearish wave on the weekly chart, the 2.272 FIB extension at 181$. The fifth target of the bearish run is the 2.618 FIB extension on the weekly chart at 155$.
On the bullish side, if the shares of Meta Platforms (Facebook/FB) break above the weekly high at 354$, that will open the door for a bullish run toward the previous all-time high at 384$. A break above the 384$ will resume the bullish trend and open the door for a bullish run toward the 2.272 FIB extension on the weekly chart around 450$.
Weekly chart:

Monthly chart:


