|
Getting your Trinity Audio player ready...
|
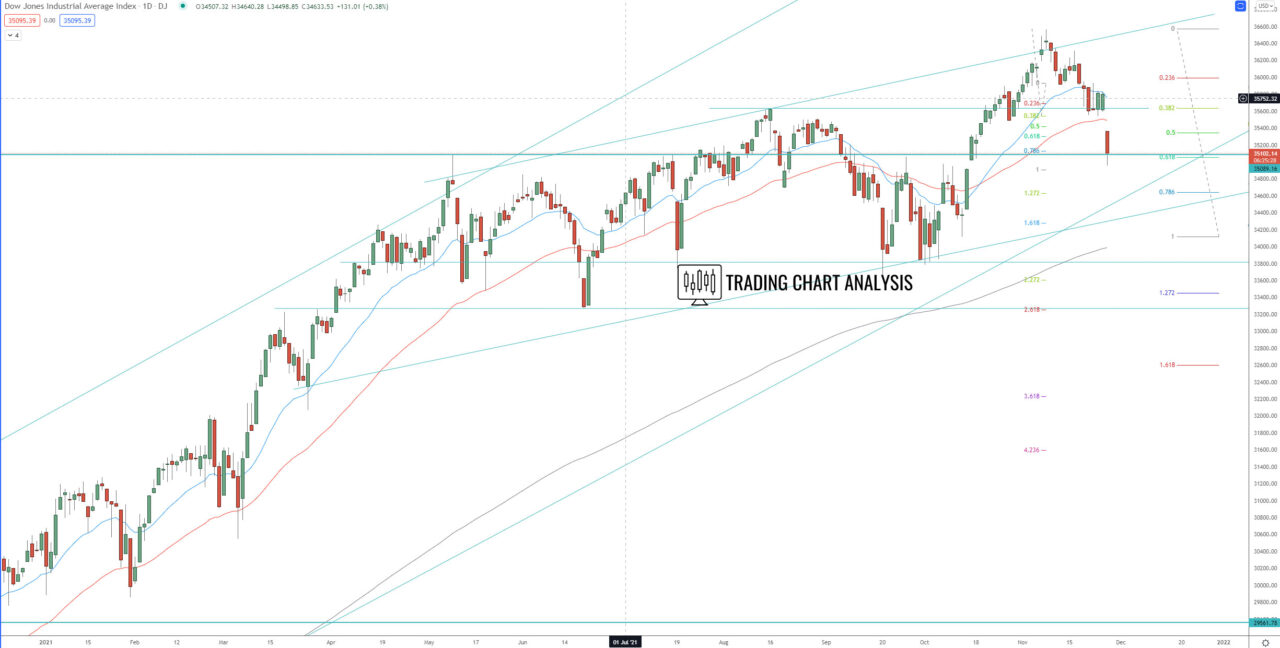
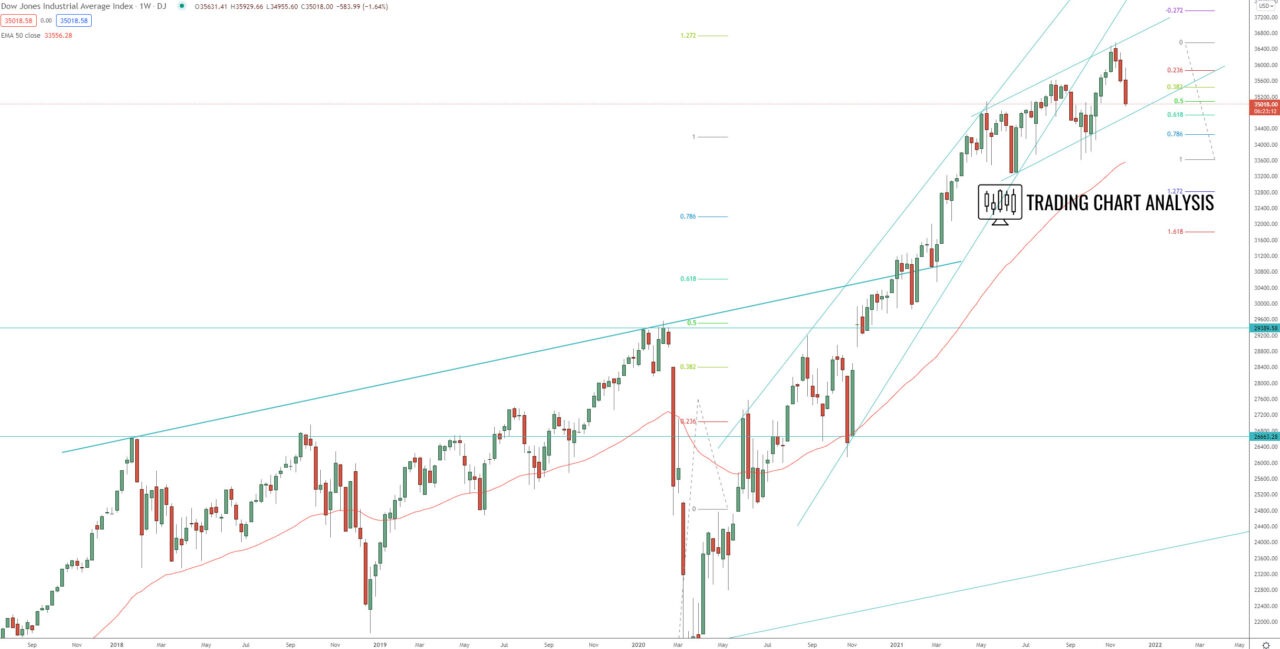
Technical analysis for Dow Jones Industrial, the index almost reached the first target of the bullish weekly wave at 1.272 FIB extension at 36 740. The index went as high as 36 565 and started a pullback. The first target of the pullback, the 0.386 FIB retracement on the weekly chart at 35 440 was reached. The second target is the 0.618 FIB retracement on the weekly chart at 35 050. The third target is the 1.272 FIB extension on the daily chart at 34 630, the fourth target is the 1.618 FIB extension at 34 270. And the fifth target is the weekly low and 2.272 FIB extension at 33 613. If the Dow Jones Industrial index breaks below the weekly low at 33 613, it will open the door for a bearish run toward the 0.386 FIB retracement on the monthly chart at 32 590.
On the other hand, if the Dow Jones index breaks back above 35 929, it will be an early signal for a resumption of the bullish trend. The first target for this potential breakout above 35 929 is the high at 36 316. The second target is the previous all-time high at 36 565.
If the Dow Jones Industrial breaks above the previous all-time high at 36 565, that will be a signal for resumption of the weekly bullish trend. The second target for the weekly bullish wave is the 1.616 FIB extension at 40 000.
Daily chart:

Weekly chart:


