|
Getting your Trinity Audio player ready...
|
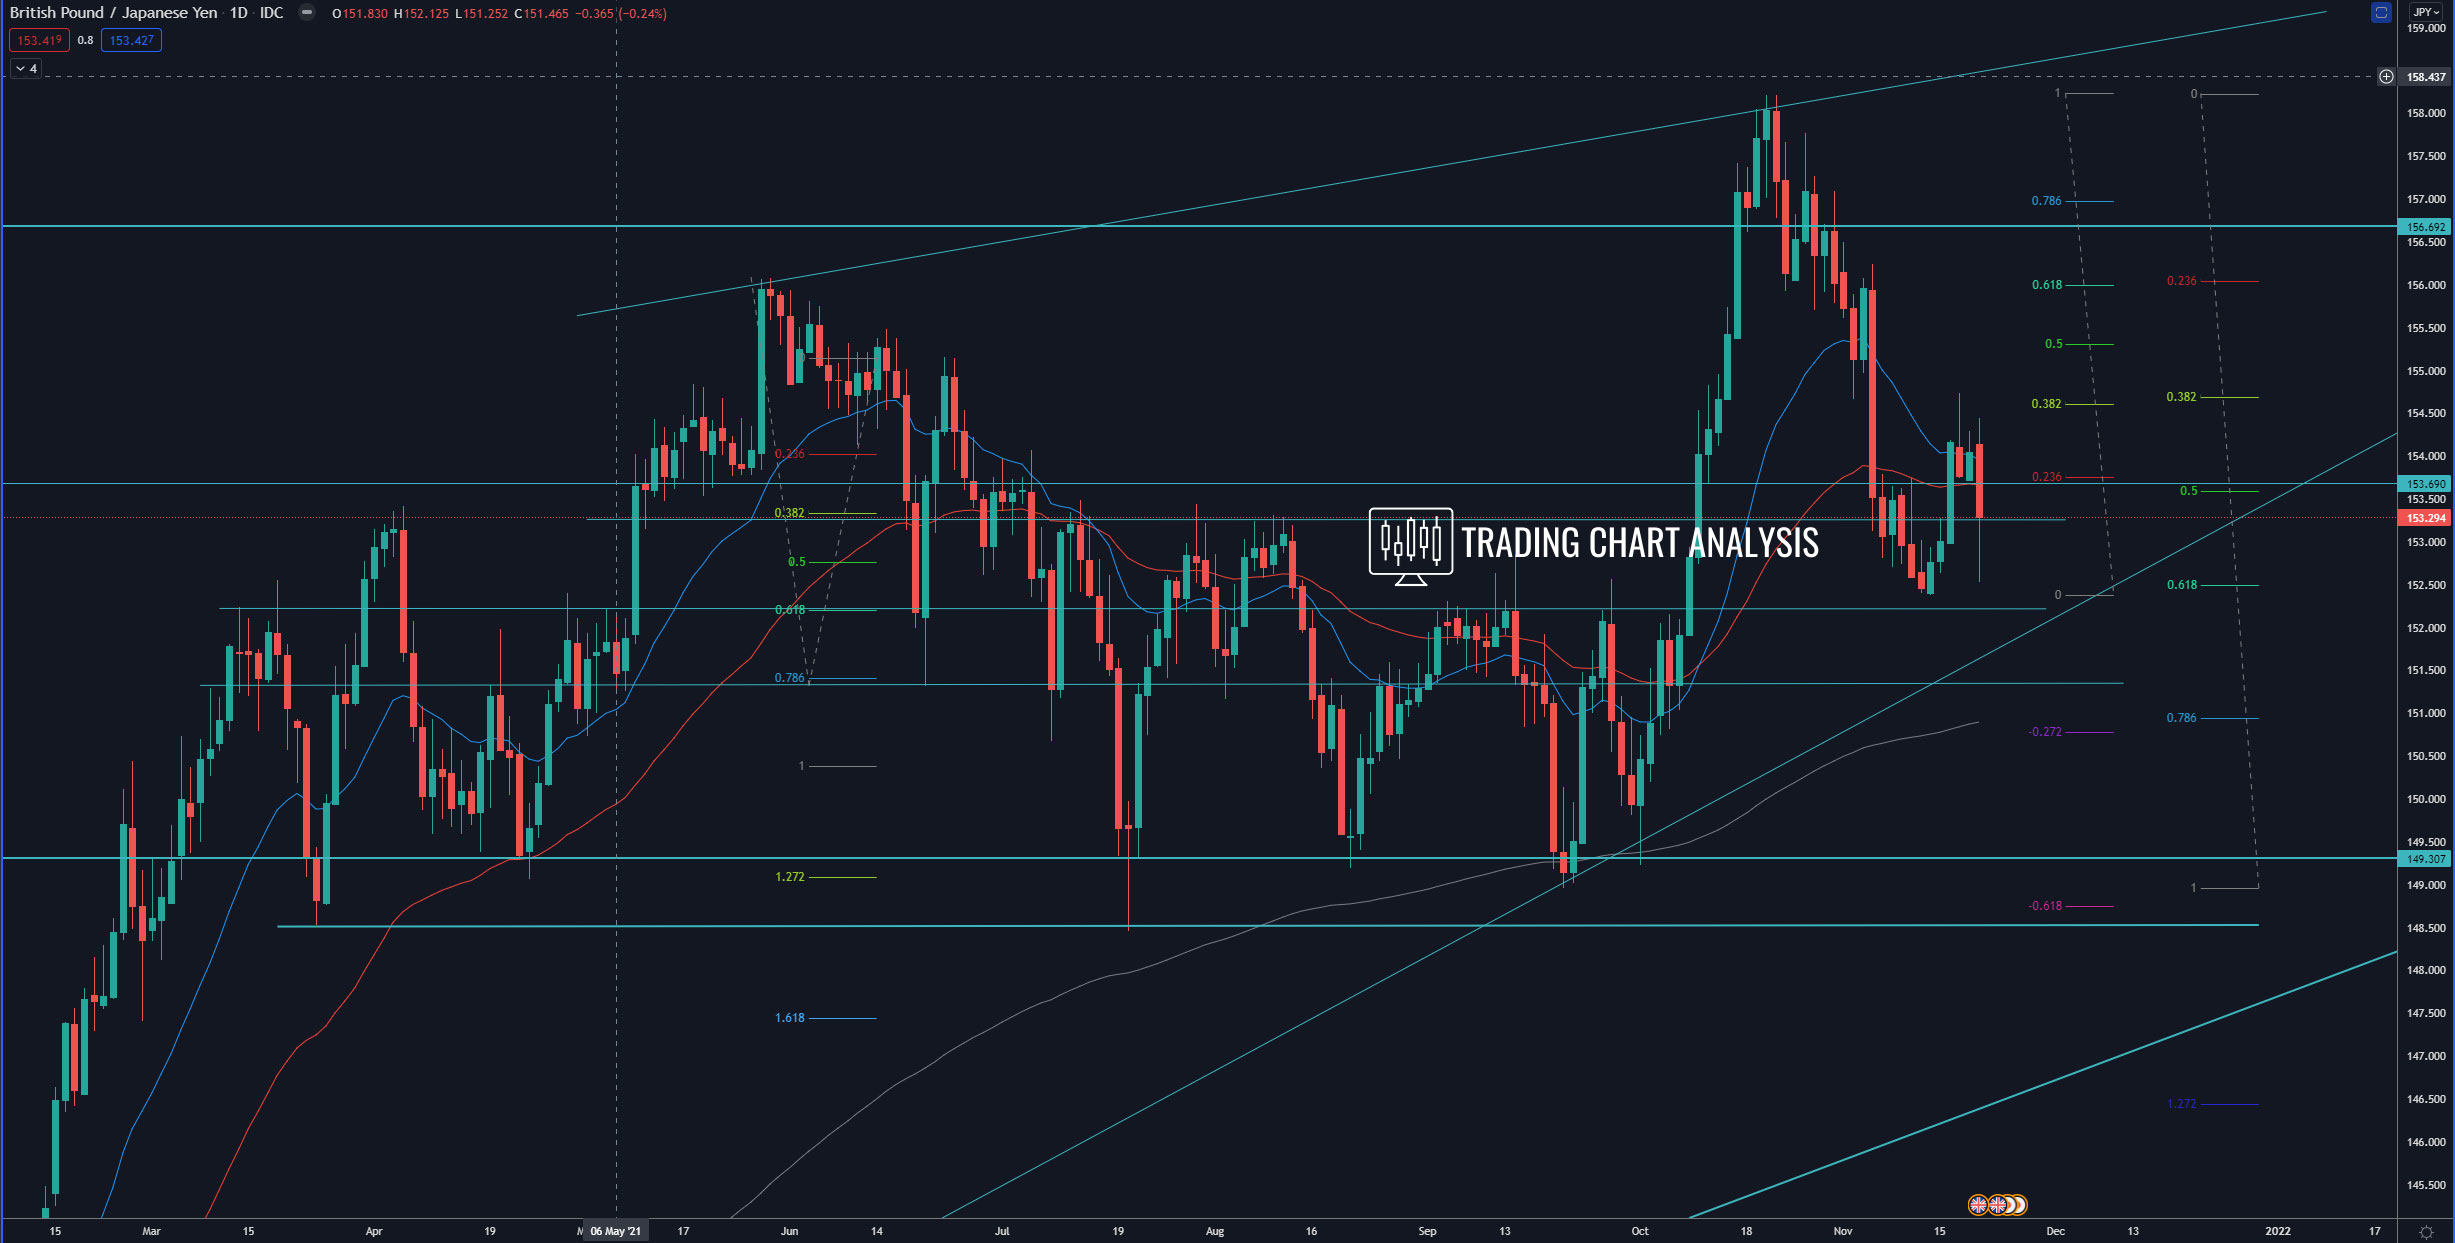
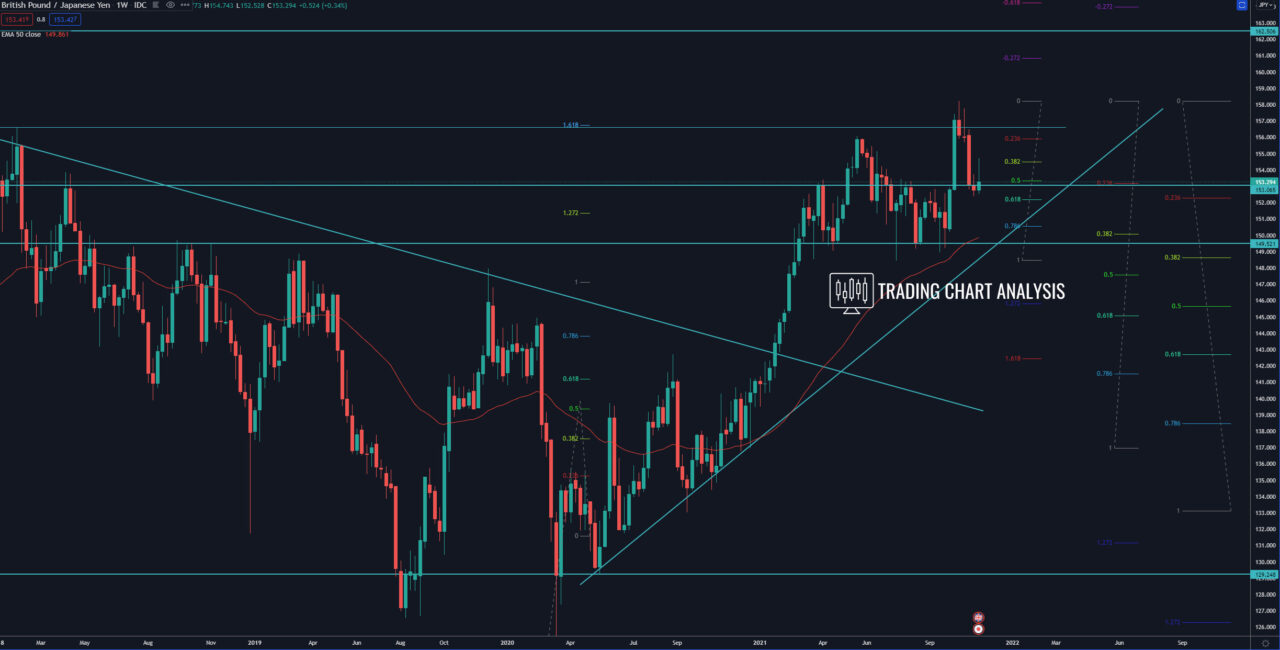
Technical analysis for the GBP/JPY, the pair reached the second target of the third bullish weekly wave at 1.618 FIB extension at 156.75. The GBP/JPY pair went as high as 158.21 and started a pullback. This pullback reached the 0.618 FIB retracement on the daily chart and bounced from it. On the four-hour and the one-hour charts, the GBP/JPY formed a double bottom. On the weekly chart, the forex pair GBP/JPY closed with a shooting star candle, which is a signal for resumption of the bullish trend. If we see a break above 154.74, that will open the door for a bullish run toward 0.618 FIB retracement on the daily chart and resistance at 156.00. And a break above 156.00 will send the GBP/JPY pair higher for a retest of the previous high at 158.21.
If the GBP/JPY breaks above 158.21, it will extend the bullish weekly trend and will have significant bullish implications. Such a break will open the door for a bullish run toward, first the resistance at 162.00, second toward 164.00, and third the 2.272 FIB extension at 166.80-167.00.
On the other hand, if the GBP/JPY breaks below 152.38-20, it will open the door for a bearish run toward first the 1.272 FIB extension at 151.70. And second toward the 1.618 FIB extension at 150.40-50.
Daily chart:

Weekly chart:


