|
Getting your Trinity Audio player ready...
|
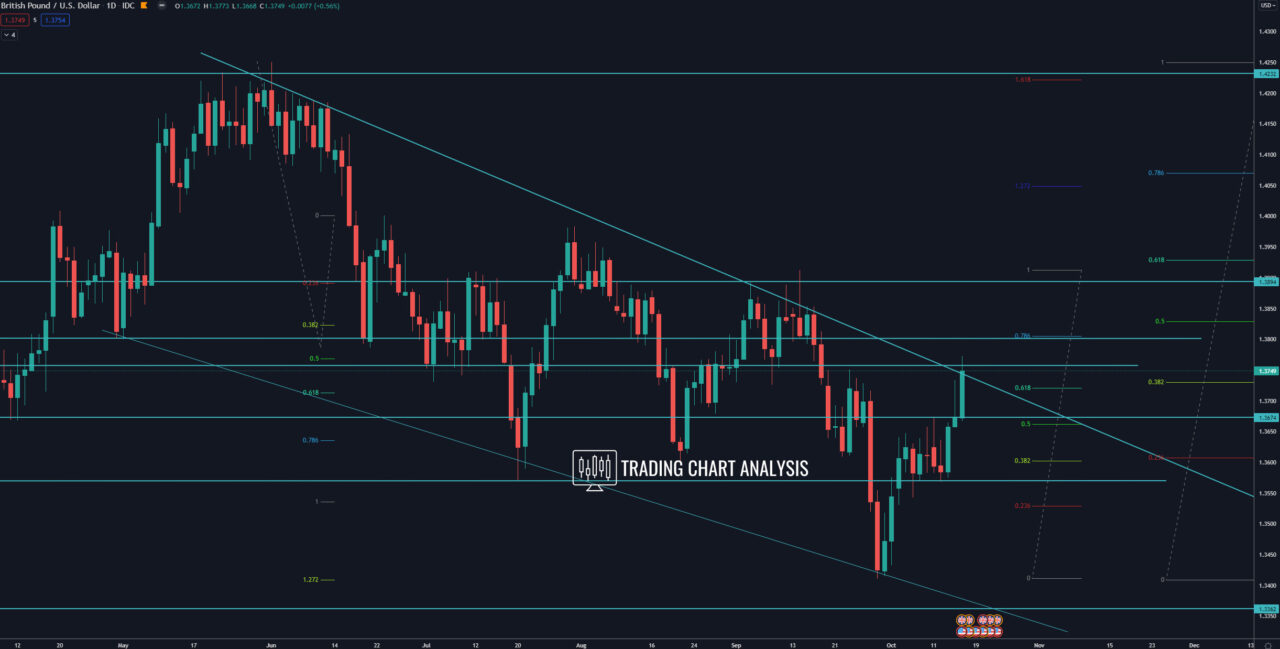
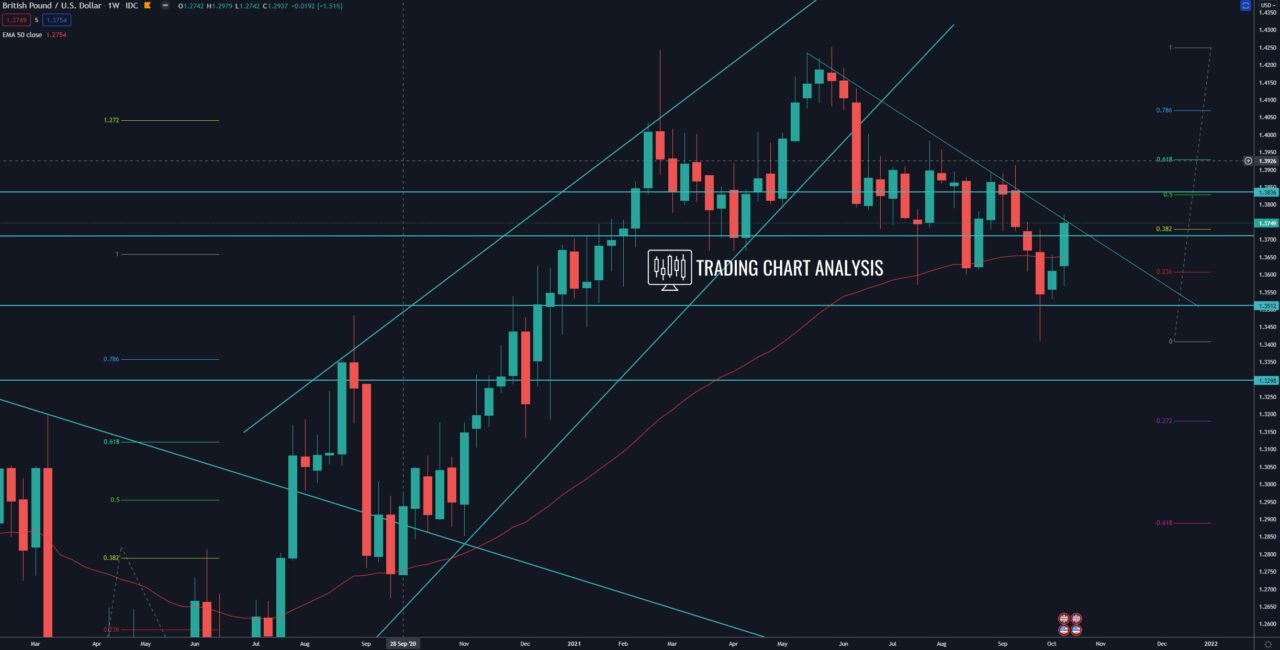
Technical analysis for the GBP/USD, the pair reached an important resistance area, descending trend line and the previous daily high at 1.3751. If the GBP/USD close above the descending trend line, that will be a break above the descending price channel on the daily chart and a break above the descending wedge on the weekly chart. Such a break will have significant bullish implications for the GBP/USD, and it will open the door for a bullish run toward the previous high at 1.3909 and the 1.3930, which is the 0.618 FIB retracement on the weekly chart.
Looking at the bigger picture, the breakout of the range between 1.4000 – 1.3572 opened the door for a further bearish run for the GBP/USD. The first target of that bearish run was the 1.272 FIB extension at 1.3410 and was reached. Therefore, the focus now is on the support zone between 1.3570-1.3540, a break below that zone will resume the bearish pressure, and it will send the price lower toward the previous low at 1.3410. A break below the previous weekly low at 1.3410 will resume the weekly bearish wave and open the door for a bearish run toward the 1.618 FIB extension at 1.3250.
Daily chart:

Weekly chart:

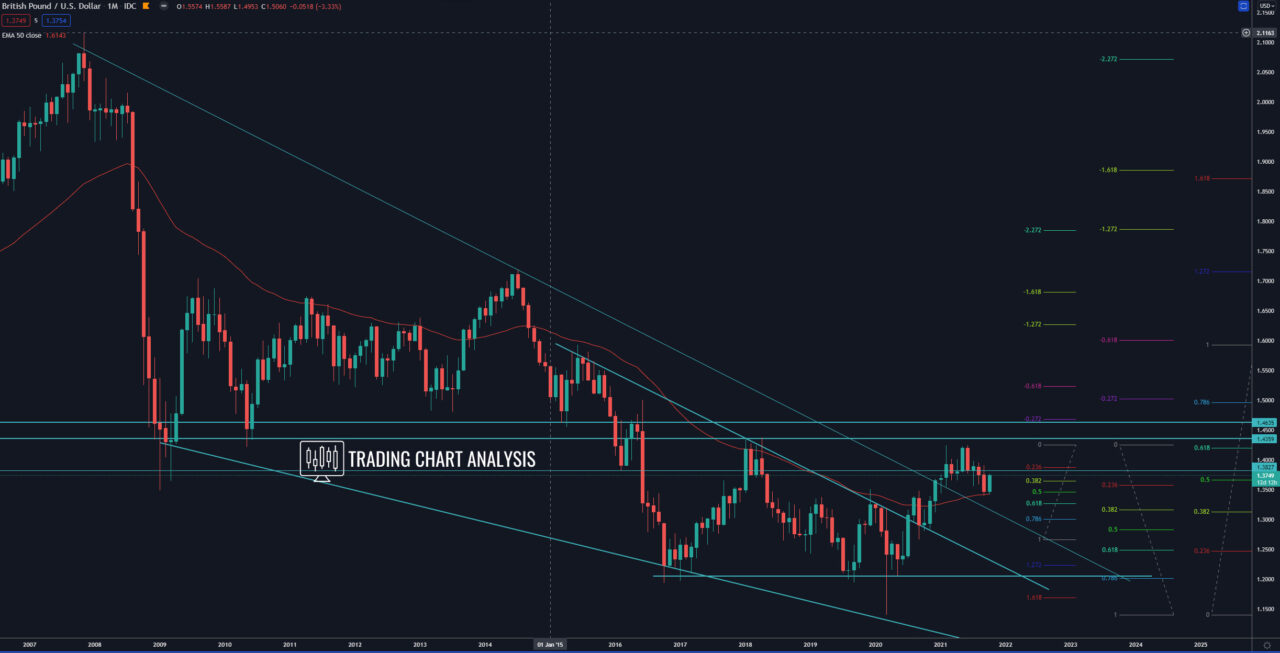
Monthly chart:


