|
Getting your Trinity Audio player ready...
|
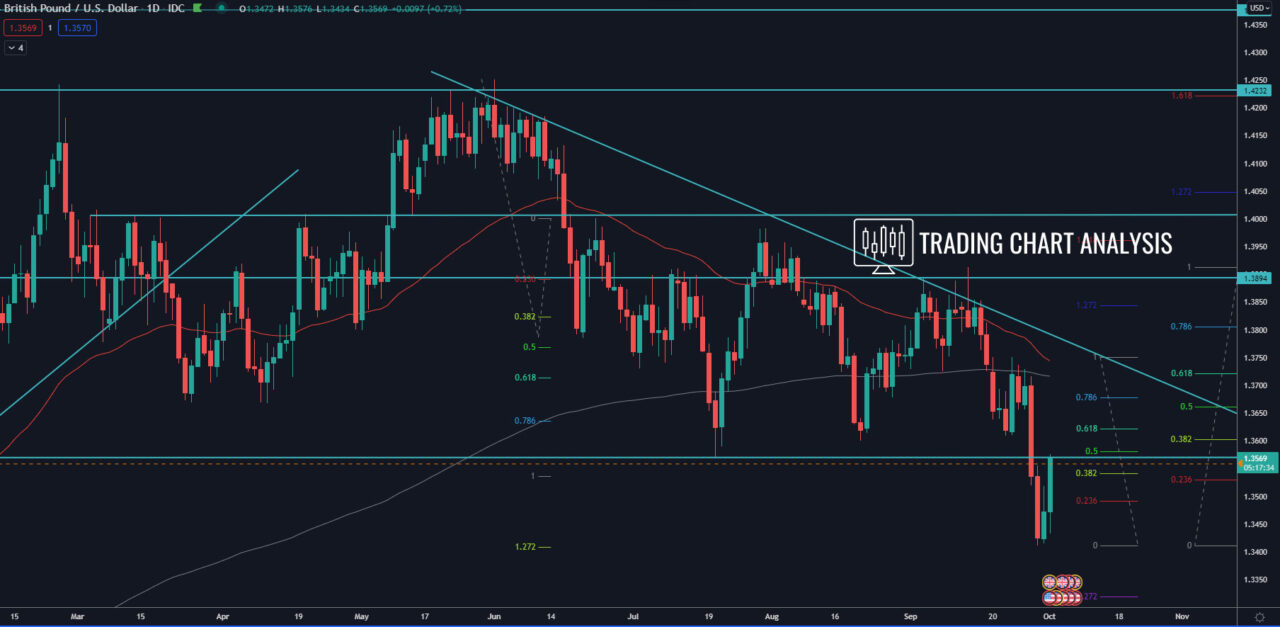
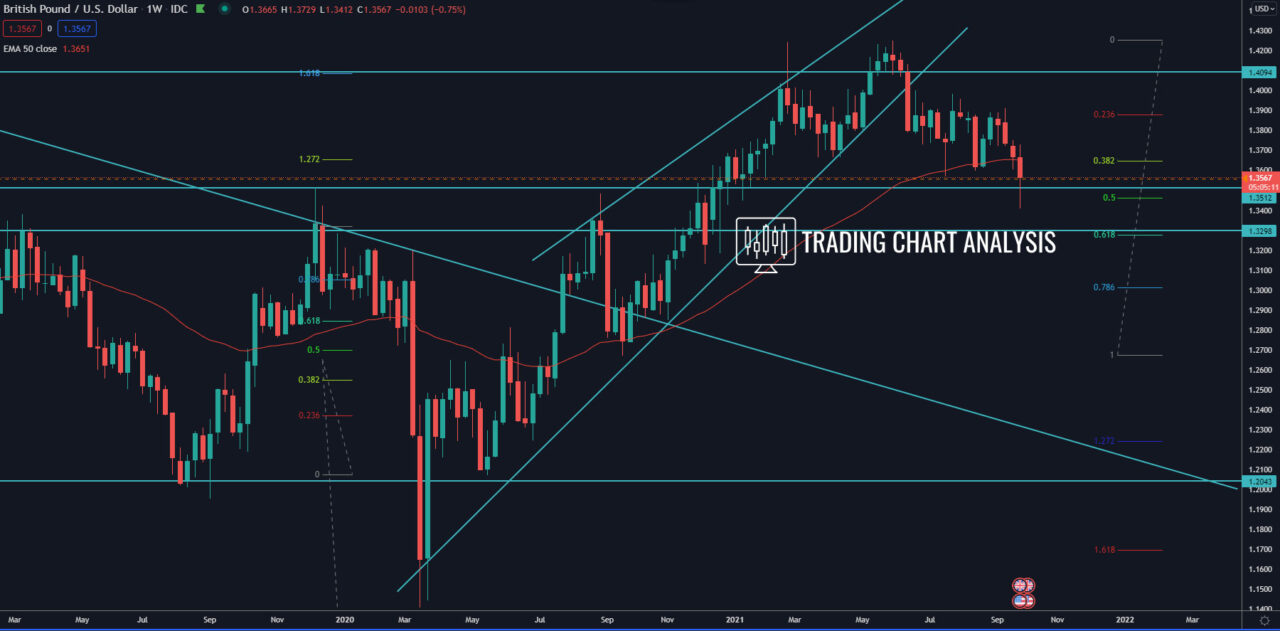
Technical analysis for GBP/USD, the pair reached the first target of the bearish daily wave at 1.272 FIB extension at 1.3410, which was close to the 0.500 FIB retracement on the weekly chart. The second target for this daily bearish wave is at 1.618 FIB extension at 1.3250, which is around the 0.618 FIB retracement on the weekly chart.
The GBP/USD pair bounced from the support zone and the first target of the bearish daily wave at 1.3410 and started a pullback on the daily chart. The first target of this pullback, the 0.386 FIB retracement at 1.3540 was reached. The second target is the resistance zone between 1.3585-1.3610. The third target is at the 0.618 FIB retracement and the previous high around 1.3720.
The zone between 1.3870-1.3910, and 1.4000, are the key resistance levels for the GBP/USD forex pair.
We must note that both the DXY and the FXCM dollar indexes are sitting at a key resistance and 0.386 FIB retracement, we must see a break to the upside to confirm further strength in the USD.
Daily chart:

Weekly chart:

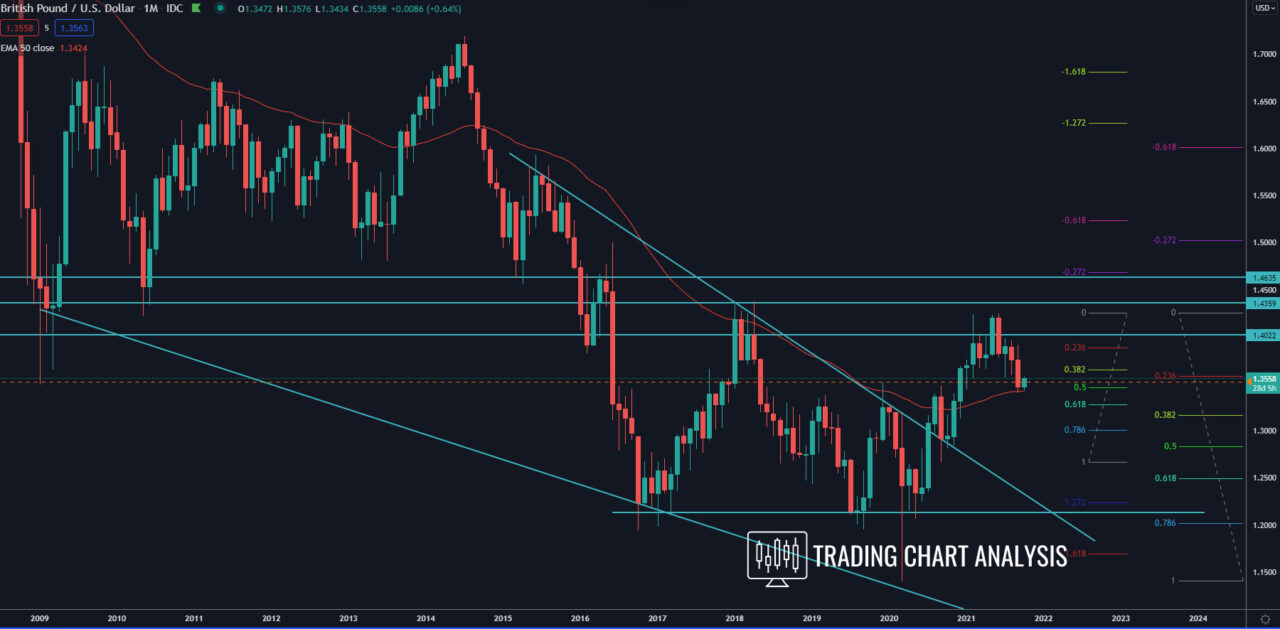
Monthly chart:


