|
Getting your Trinity Audio player ready...
|
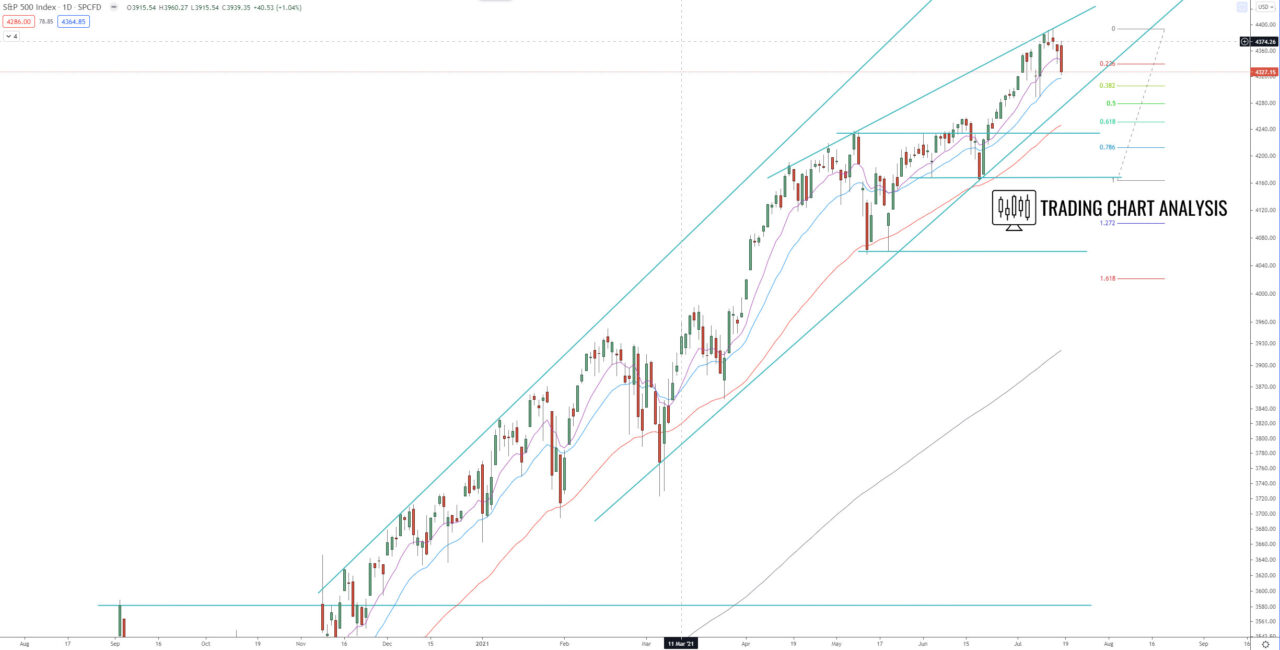
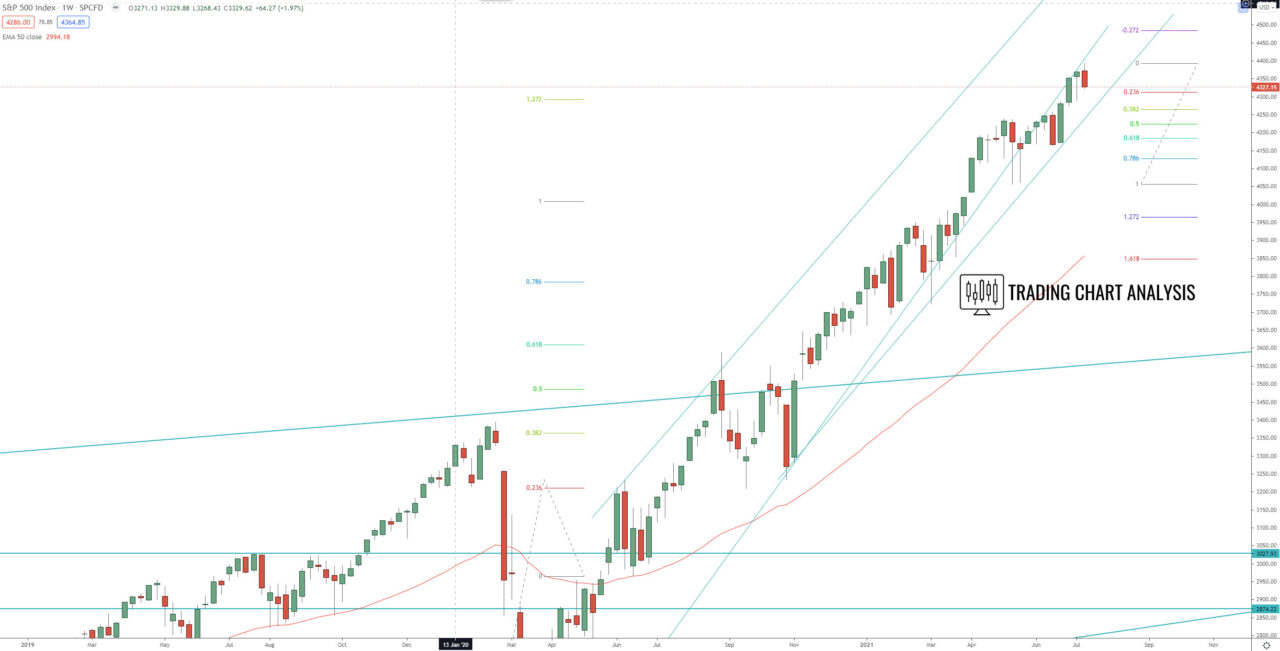
S&P 500 technical analysis, the index reached the first target of the bullish weekly wave at 1.272 FIB extension and the third target of the third bullish daily wave at 2.272 FIB extension at 4290 – 4300. The index reached as high as 4393, which open the door for a run toward the fourth target of the bullish daily wave at 2.618 FIB extension at 4530 and the second target of the third bullish weekly wave at 1.618 FIB extension at 4650.
The S&P 500 formed tweezers tops on the daily chart and double tops on the 1H chart and started a pullback. The first target of this pullback is at the 0.386 FIB retracement at 4305, the second target is the daily low at 4289, and if the index break below it, it will leads to further declines toward 0.618 FIB retracement at 4250. Correction toward the 0.386 FIB retracement on the monthly chart at 3950, can’t be ruled out at this point.
The focus for the months ahead is on the previous high at 4393. If the S&P 500 breaks above that high, it will resume the bullish daily wave and send the price toward the 2.618 FIB extension at 4530.
Daily chart:

Weekly chart:


