|
Getting your Trinity Audio player ready...
|
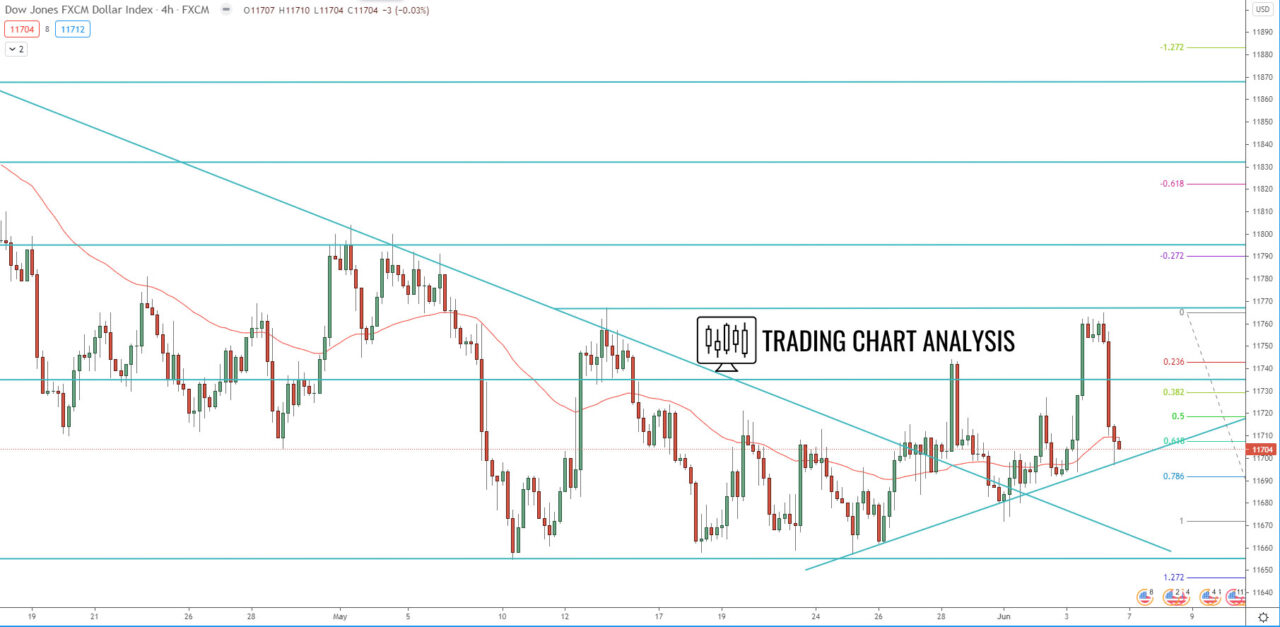
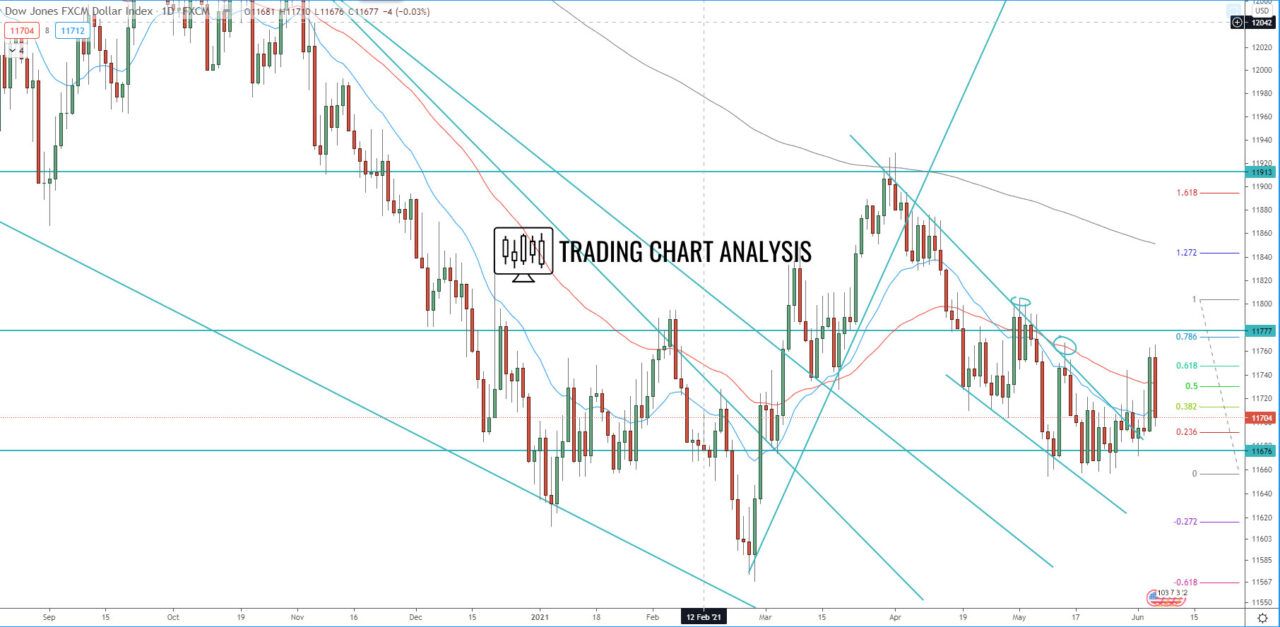
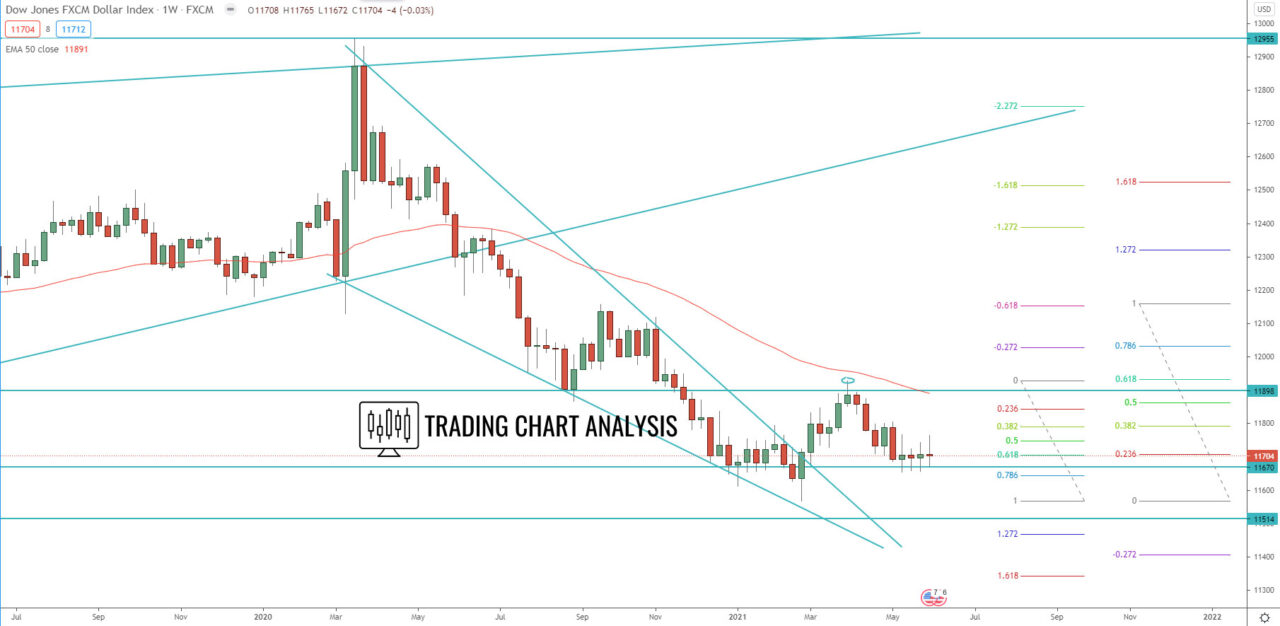
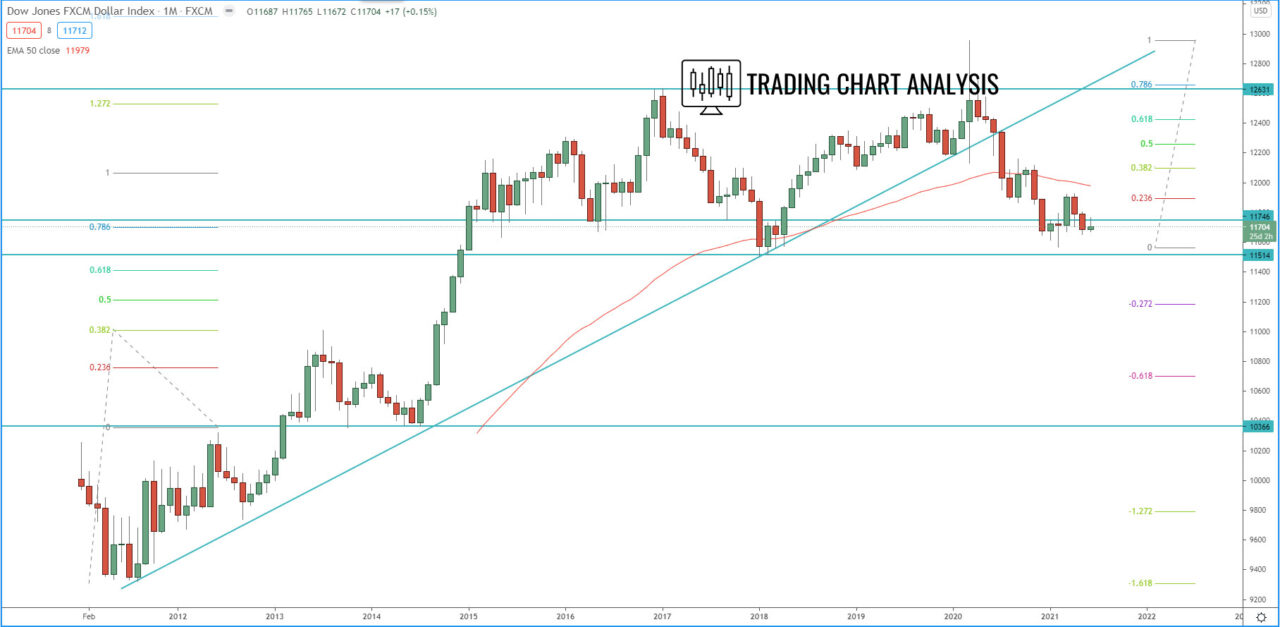
Technical analysis for the FXCM dollar index, the index is stuck in a range for four weeks. The bias is still to the downside as a continuation of the breakout, which occurred on the 7th of May. If the price break below the phase line on the 4H chart and below 11 692, it should continue lower toward the previous lows at 11 655. Break below 11 655 will send the price toward, first the February lows at 11 567, second toward the 2018 low at 11 506. If the FXCM dollar index break below 2018 low, it will open the door for a run toward 1.272 FIB extension of the 3rd weekly bearish wave toward 11 400.
The focus for the week ahead is on the previous week’s high at 11 765, if the FXCM dollar index break above 11 765, it will send the price higher toward first, the 1.272 FIB extension at 11 835, and second toward 1.618 FIB extension at 11 870.
4H chart:

Daily chart:

Weekly chart:

Monthly chart:


