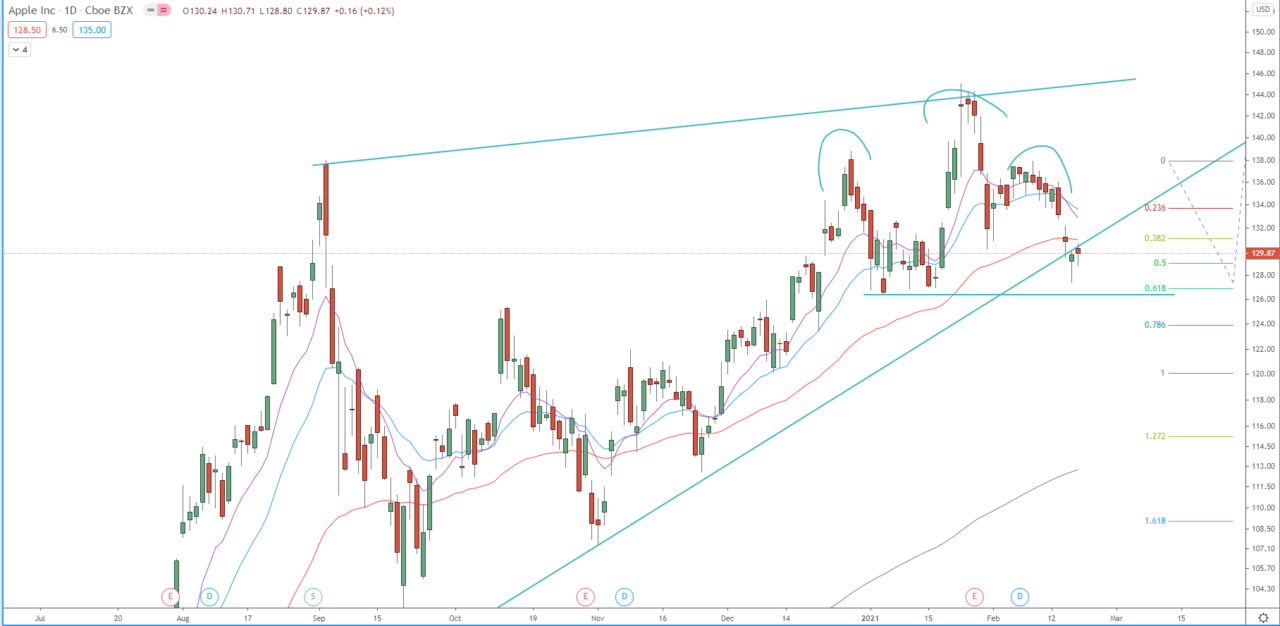
The price formed potential Head and Shoulders on the daily chart. Break below the neckline, below 126, will confirm the bearish run on the 4H chart. The first target of that bearish run is at 1.272 FIB extension around 118.90, break below that should send the price toward the 1.618 FIB extension around 113.80. On the other hand, if the price break above 138.10 it will be a signal for further upside toward the previous high at 145.00, and if it breaks above it should send the price toward 150.00 and 155.00.
Review our 2021 technical analysis for Apple Inc. shares.
Daily chart:


