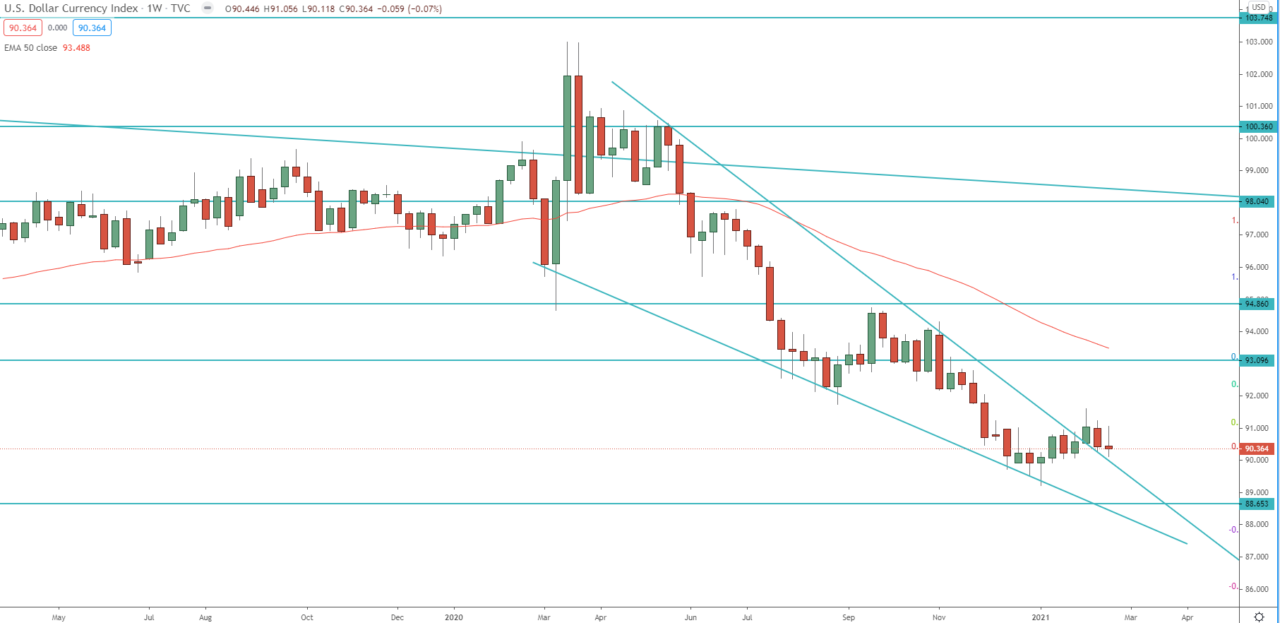
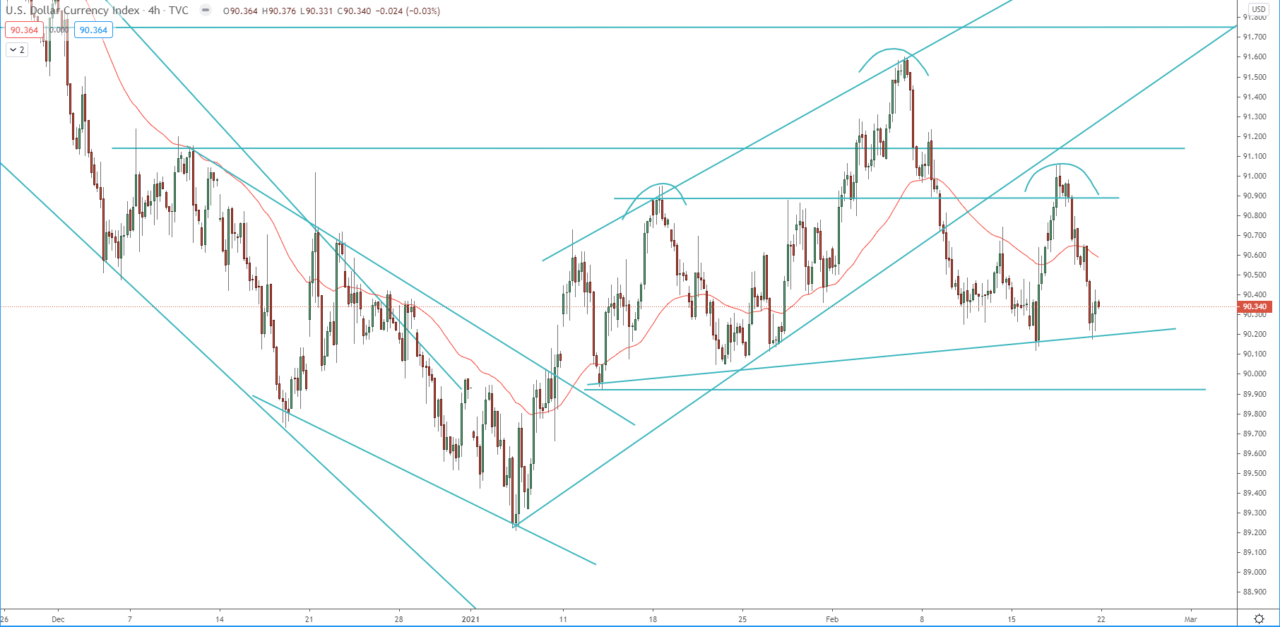
The price broke below the bearish flag on the 4H chart and formed Head and Shoulders on the 4H chart. If the price break below 89.92 we will see further declines toward, first, previous low at 89.20, second 88.60 – 88.20 which is around the 2018 low. On the other hand, this break above the weekly wedge is bullish for the index and if the price break above, first 91.06 and then 91.60 further upside is to be expected toward, first toward 92.25, second at 92.80.
Review our 2021 technical analysis for the DXY dollar index.
Weekly chart:

4H chart:


