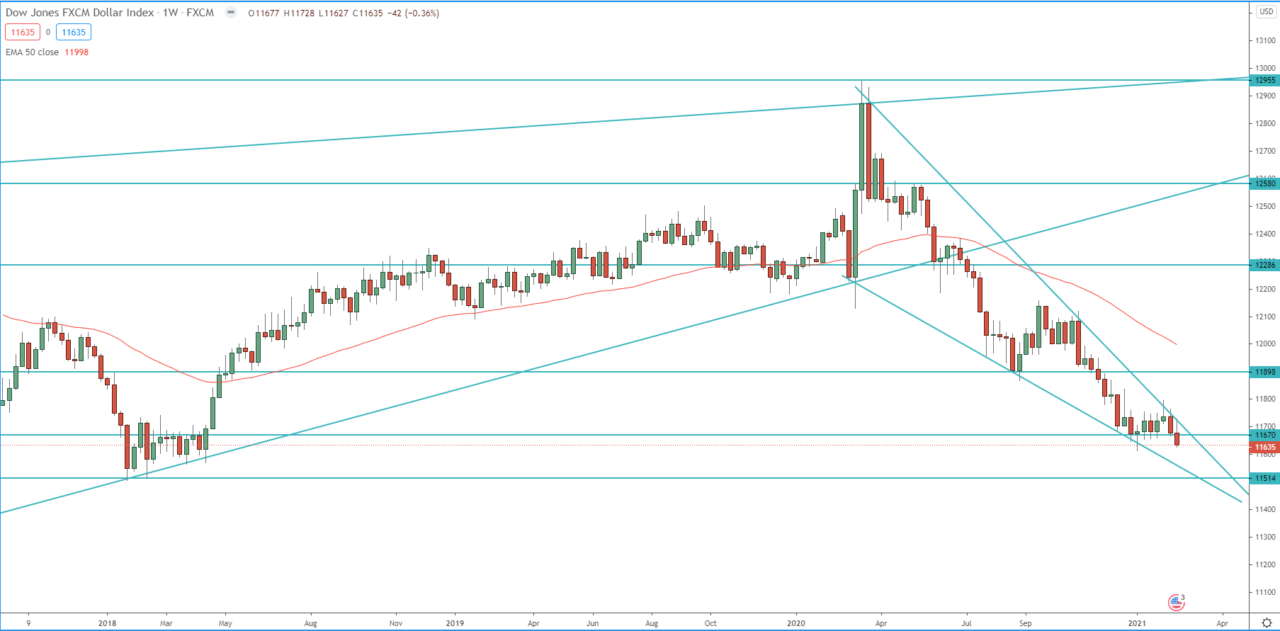
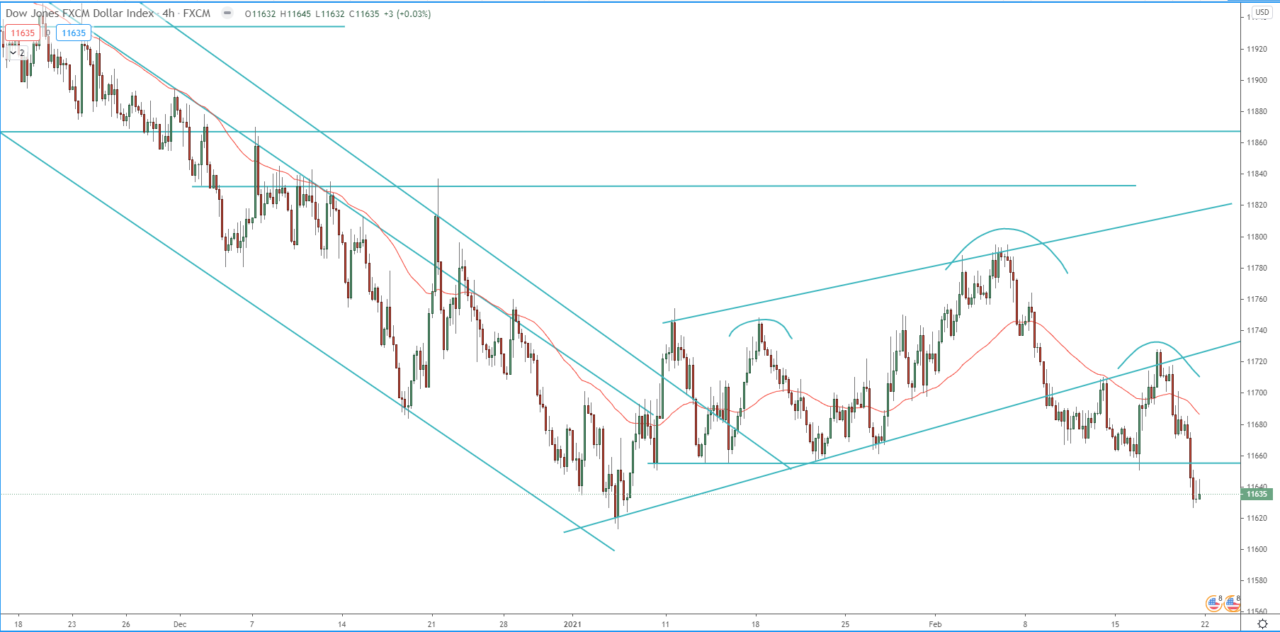
The price broke below the bearish flag on the 4H chart and below the neckline on the 4H Head and Shoulders, resuming the bearish monthly, weekly, daily trend. The first target of this breakdown is the previous daily low at 11 613, the second target is the 1.272 FIB extension around 11 545, the third target is the 1.618 FIB extension around the 2018 lows around 11 500. If the price breaks back above 11 730 it will invalidate this bearish view and perhaps will send the price in consolidation.
Review our 2021 technical analysis for the FXCM dollar index.
Weekly chart:

4H chart:


