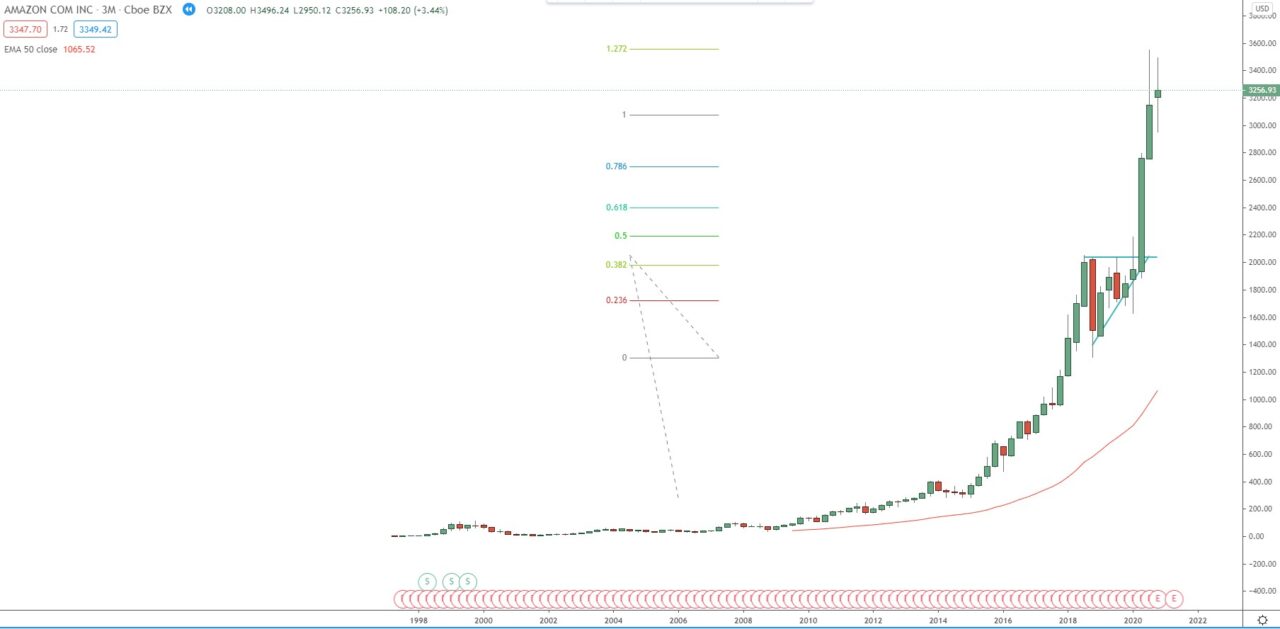
Looking at the quarterly chart, we can see that the price completed the 3rd bullish wave at 4.272 FIB extension around 2050 and started 36.00% decline. That decline formed ascending triangle on the monthly, weekly charts, which the price broke in April 2020 starting the 5th quarterly bullish wave. The price reached 1.272 FIB extension around 3550 of that wave, if we see break above that next target for the stock is the 1.618 FIB extension around 4160.
Quarterly chart:


