technical analysis for 2021
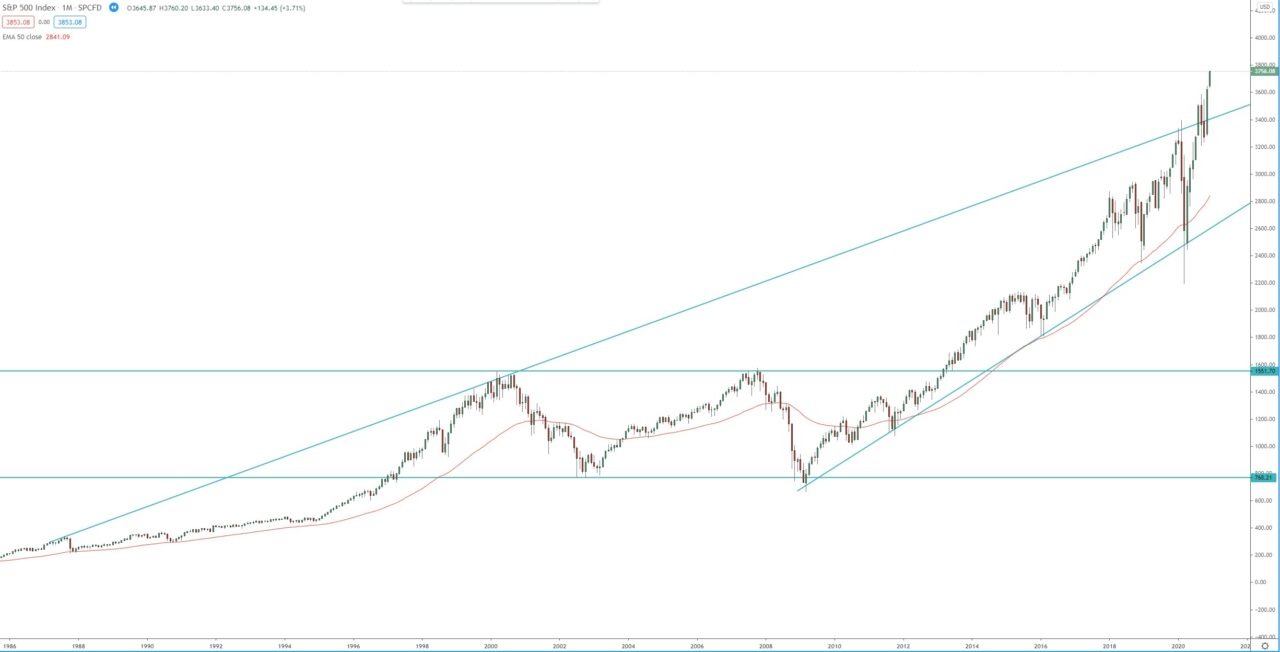
Study on the monthly char shows that the first target of the bullish breakout above the 2007 high, which occurred in 2013 was reached in December 2020 around 3680.
Next target for this bullish monthly wave is at 1.618 FIB extension around 4200.
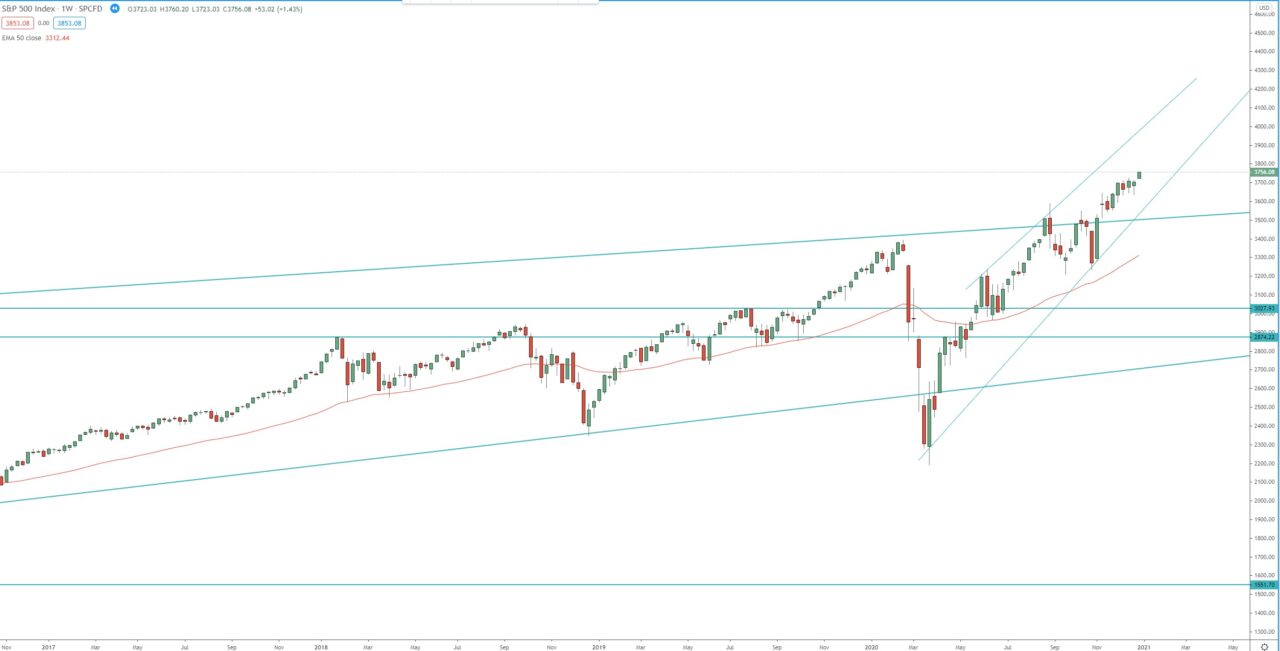
Weekly chart broke above the pre-pandemic high, the first target of that bullish wave is at 1.272 FIB around 4290. Interesting enough this is the target of many wall street/ hedge funds shops for the index for the 2021.
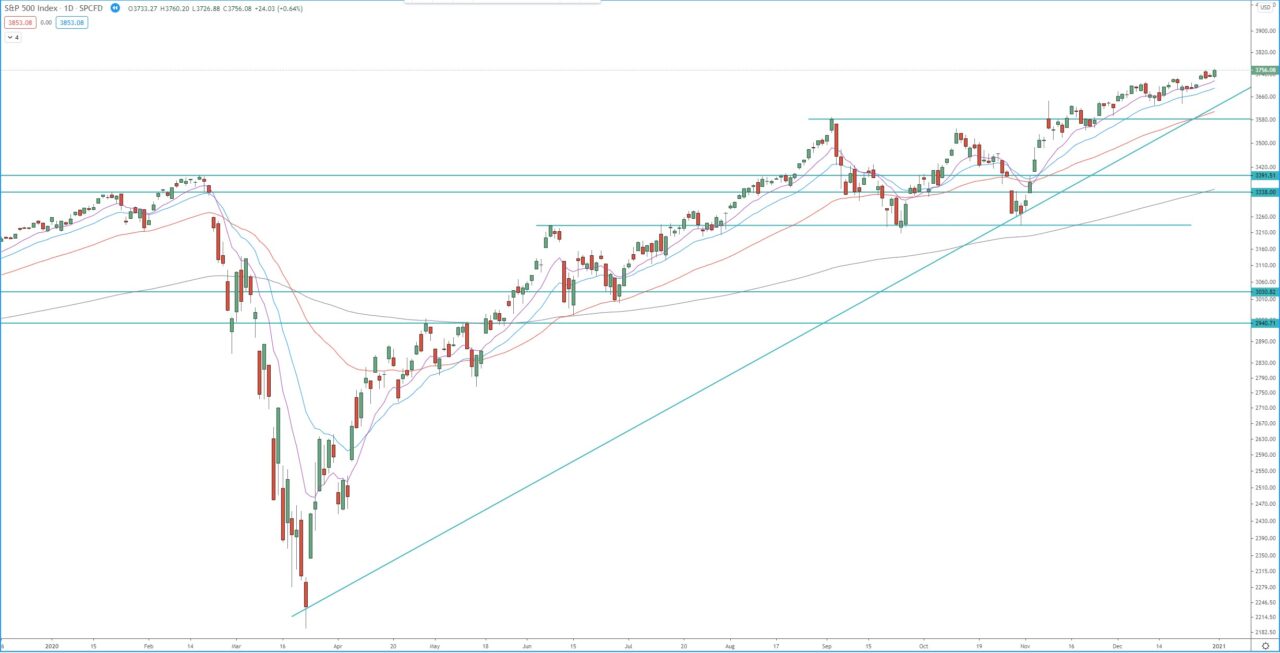
The daily chart is in its 3rd bullish wave, after the break above the pre-pandemic high. The first target of that wave was reached at 1.272FIB extension around 3600, second target is at 1.618 FIB extension around 3850. If the price break above 3850, than we have 2.272 FIB extension, again around 4290.
Monthly chart:

Weekly chart:

Daily chart:


